
Update To I Fund Special Report
On 10 March 2025 we posted an I Fund Special Report, highlighting the long-term trend of the I fund vs the C fund. At the time, the I fund was a focus for TSP investors as it had been outperforming the C fund since late 2024. In that report, we detailed two metrics that MUST be met before "buy & hold" investors should consider reallocating from the C fund to the I fund. We highly suggest reading that report before this update! You can find the I Fund Special Report here.
* In both the report and this update, we are using the old I fund (ticker symbol EFA) as significantly more historical data is available *
The Metrics
New all-time highs
A change in the trend of the I fund vs the C fund
The chart below shows the progress of the I fund following the post on 10 March. As we can see, the first metric has been hit. The I fund is now well into new high territory having broken through the resistance channel in April. This upside breakout is extremely significant as it took out the top from all the way back in 2007!
The second metric is more elusive and is yet to be hit.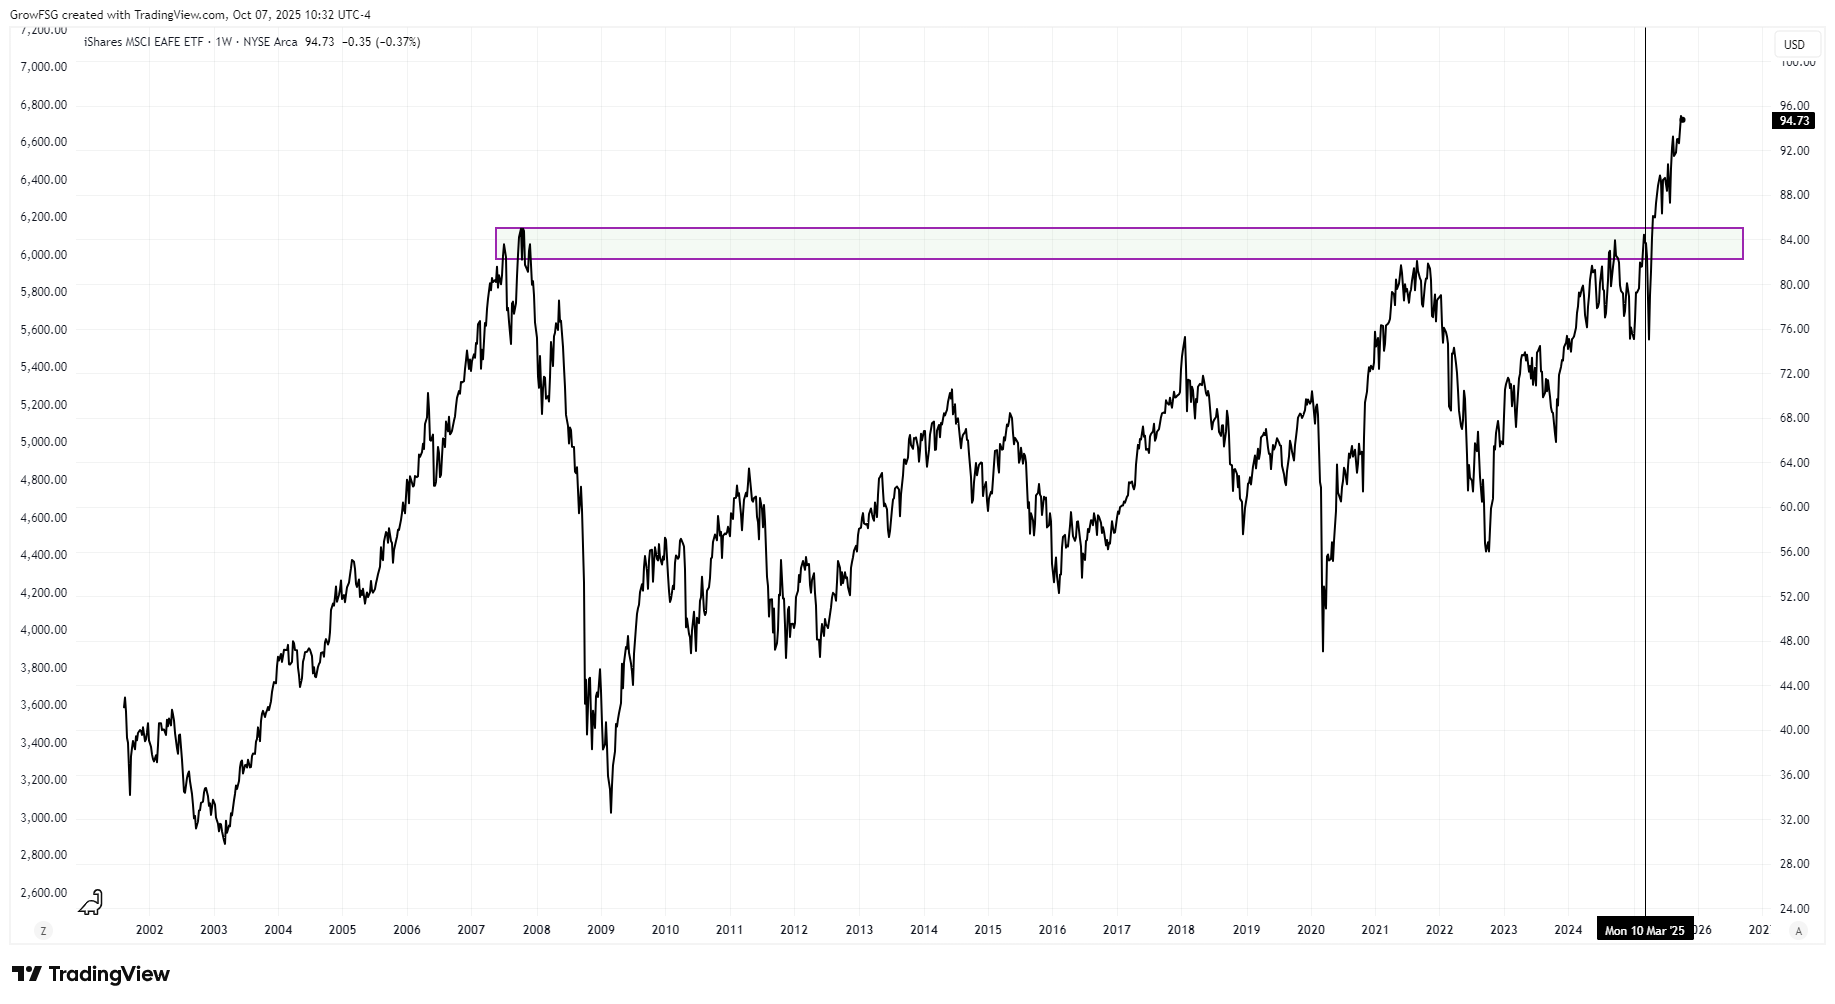
I Fund vs C Fund
"Buy & Hold" investors tend to pick one fund, or a combination of funds, and hold them regardless of market ups and downs. To maximize performance over time, it is best to be allocated in the fund that is outperforming the others. How do we determine which fund that is? We simply compare one to the other using ratio charts.
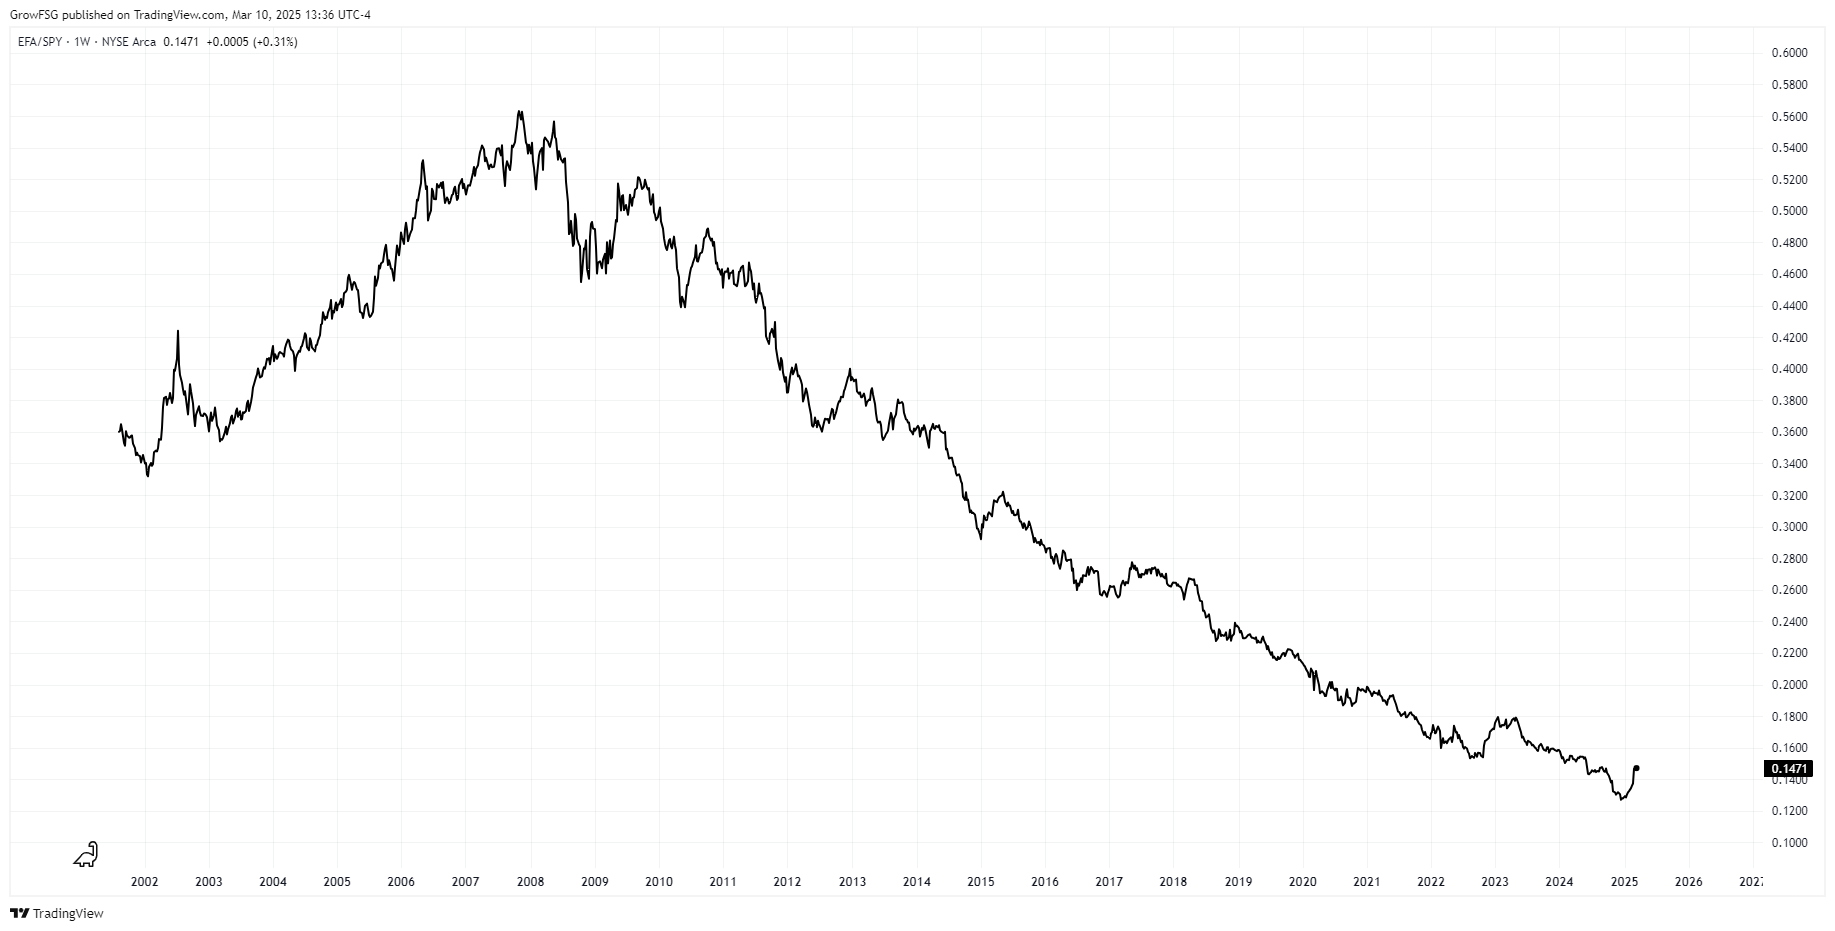
The chart below shows the I fund vs the C fund from inception in 2001 to 10 March 2025. We posted this chart in the I Fund Special Report. The chart shows the weekly price of the I Fund divided by the weekly price of the C fund over time. When the line is trending up, the I fund is outperforming the C fund. When the line is trending down, the C fund is outperforming the I fund.
From 2002 to 2007, investors who were allocated to the I fund grew their accounts much faster than those allocated to the C fund. While both funds moved higher over that time period, more gains were seen in the I fund than the C fund.
Beginning in 2008, that trend reversed. From 2008 to 2025, the C fund has outperformed the I fund. There have been brief periods along the way where the I fund outperformed the C fund, but the long-term trend has clearly been C fund outperformance since 2008.
January to March 2025 was a period of I fund outperformance within the longer trend of C fund outperformance. As we explained in the I Fund Special Report, we need to see a change in the long-term trend of the ratio before "buy & hold" TSP investors should consider reallocating from the C fund to the I fund.
The chart below is an update to the above chart through 07 October 2025. We can see that the recent short-term period of I fund outperformance peaked in April and rolled over as the long-term downtrend continues.
Many TSP investors were caught up in the media hype and short-term performance of the I fund early in 2025. They saw this as a great opportunity to boost their gains by reallocating from the C fund to the I fund. In hindsight, that may turn out to be a great decision! We just don't know yet. We still do not have a change in the long-term trend of C fund outperformance.
What do we need to see in the chart to identify a change in the long-term trend?
An uptrend is identified by higher highs and higher lows, as we saw from 2002 to the peak in 2007. A downtrend is identified by lower highs and lower lows, as we saw from the first lower high in 2008 to the lower high in April 2025. The ratio has been essentially flat from July to October 2025, half way between the 2025 peak and the 2024 low.
A close above the April 2025 peak would give us a higher high in the ratio. This would be our first indication that the long-term trend has changed. A close below the late 2024 low would confirm a continuation of the long-term downtrend.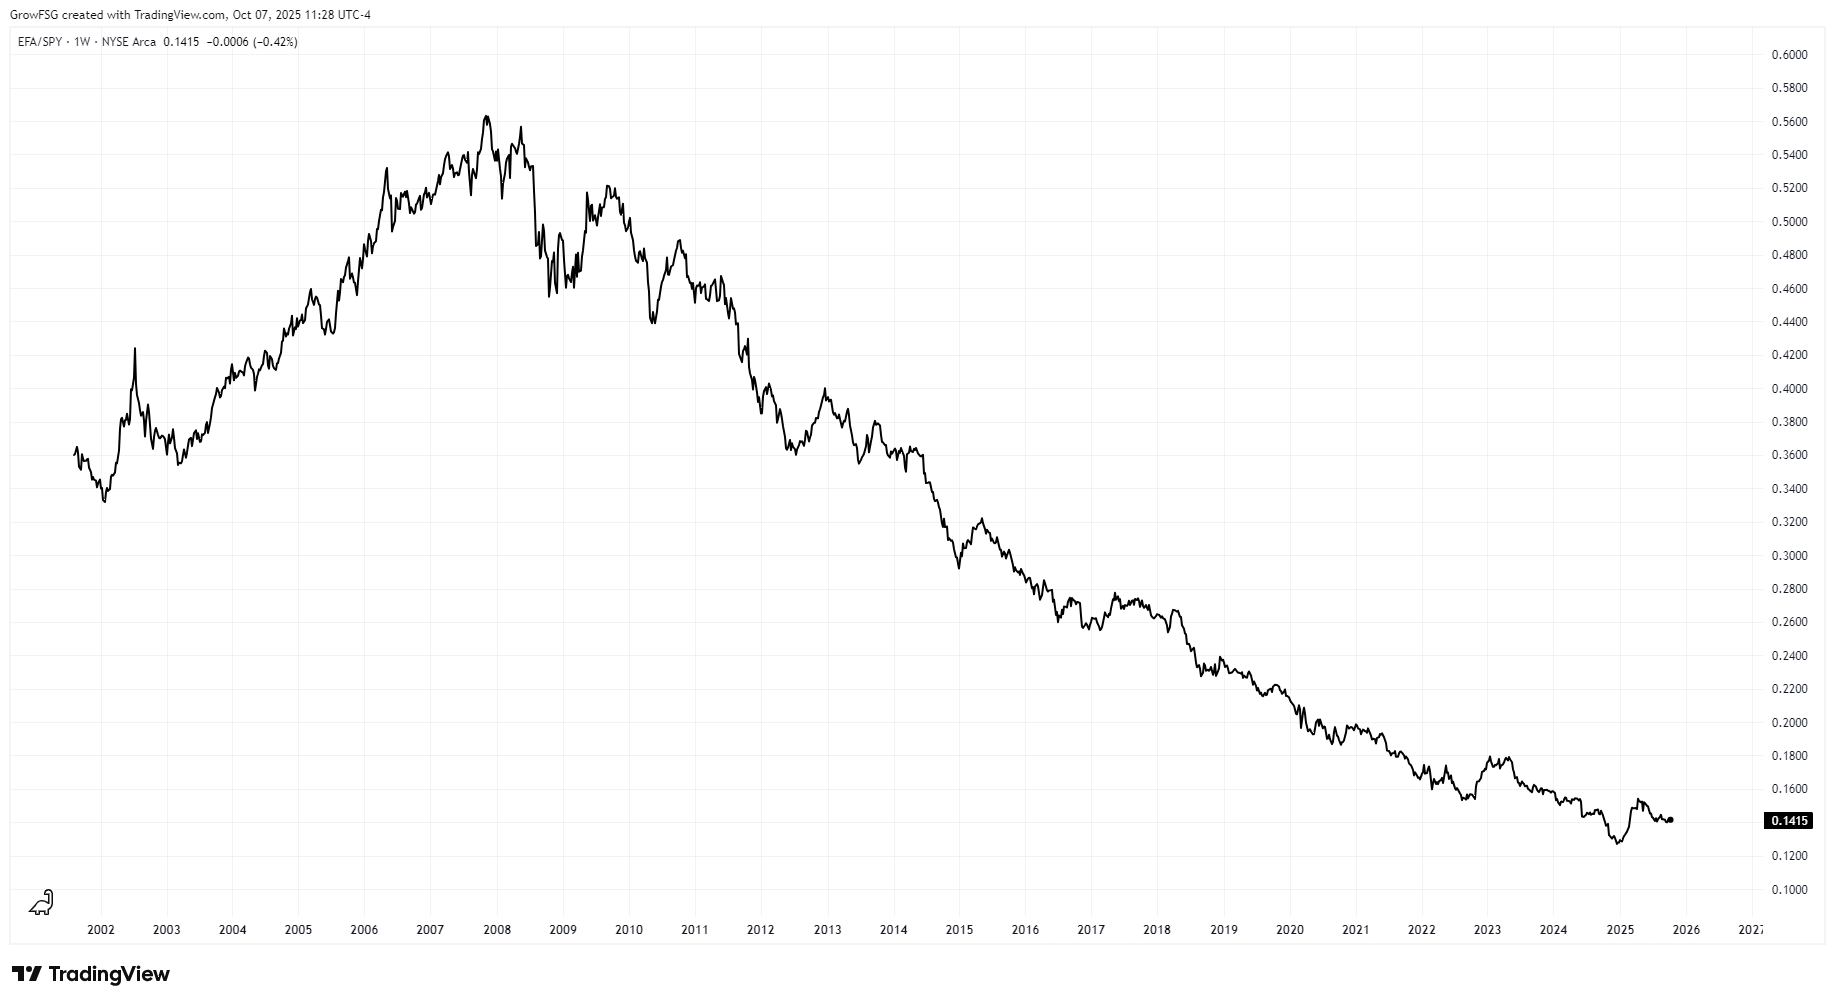
A Word About Ratio Charts
Ratio charts are NOT price charts. They are charts of the ratio between two price charts. This is CRITICAL to understand!
In the charts above, when the line is trending up, the I fund is outperforming the C fund. That does not necessarily mean that the actual price of the I fund is going up. If the actual price of both the I and C funds are falling, but the I fund is not falling as fast as the C fund, then the I fund is still outperforming relative to the C fund. The trend of the ratio would still be moving higher.
For "buy & hold" investors, this is not very significant. Their only concern is to be in the fund that is outperforming regardless of price volatility. For TSP investors who actively manage their account, this is very significant. If both the I and C funds are falling, active TSP investors do not want to be allocated to either fund.
Bottom Line
For "buy & hold" TSP investors, the methodology is simple. Invest as much into your TSP each payday as your circumstances will allow. The question is, to which fund do you choose to contribute? A simple ratio chart will show you the answer.
As of early October 2025, the long-term ratio chart still favors the C fund over the I fund. If and when that changes, you will see it in higher highs. The same analysis can be done between the C and S funds or S and I funds. Ratio charts show what is actually happening and gives you a data based tool to make reallocation decisions. It's a much better way to make decisions than watching the news and trying to anticipate what might happen in the future.
If you like this type of analysis, consider subscribing at GrowMyTSP.com. We offer a personalized TSP investment plan, various allocation models, and weekly newsletters to help keep your TSP investing on track!
----------------------------------------------------------------------------------------------------------
GrowMyTSP.com does not provide personal investment advice. We are an education and analysis service, helping TSP investors grow their accounts using strategies and models that best fit their personal circumstances and risk tolerance. Get started at GrowMyTSP.com.
