
I Fund Special Report
The C fund and S fund are both negative for the year as of early March 2025, while the I fund is well into the green. Many TSP investors are beginning to notice and wondering what's going on...
Conventional wisdom among most TSP investors is to avoid the I fund. The vast majority believe that some combination of "Buy & Hold" C and S funds is ALWAYS the best allocation. To be fair, it's easy to understand this sentiment. The I fund has underperformed both the C and S funds for well over a decade but this has not always been the case. From January 2002 to October 2007, the I fund more than doubled the gains of the C fund! It's been a LONG time but is the I fund making a comeback? Will the I fund be the outperformer going forward? If so, should TSP investors reallocate to the I fund?
To answer these questions, there are two components. First is relative performance. This is a comparison of the long-term performance trend of the I fund vs the C fund. If the I fund is outperforming the C fund, we want to be in the I fund. Second is nominal gains or losses. If both the I and C funds are declining, the I fund could outperform the C fund just by declining less. If both the C and I funds are declining, we don't want to be allocated to either fund.
We are using the Europe, Asia, Far-East Index ETF (EFA) as a proxy for the I fund, and the S&P500 Index ETF (SPY) for the C fund.
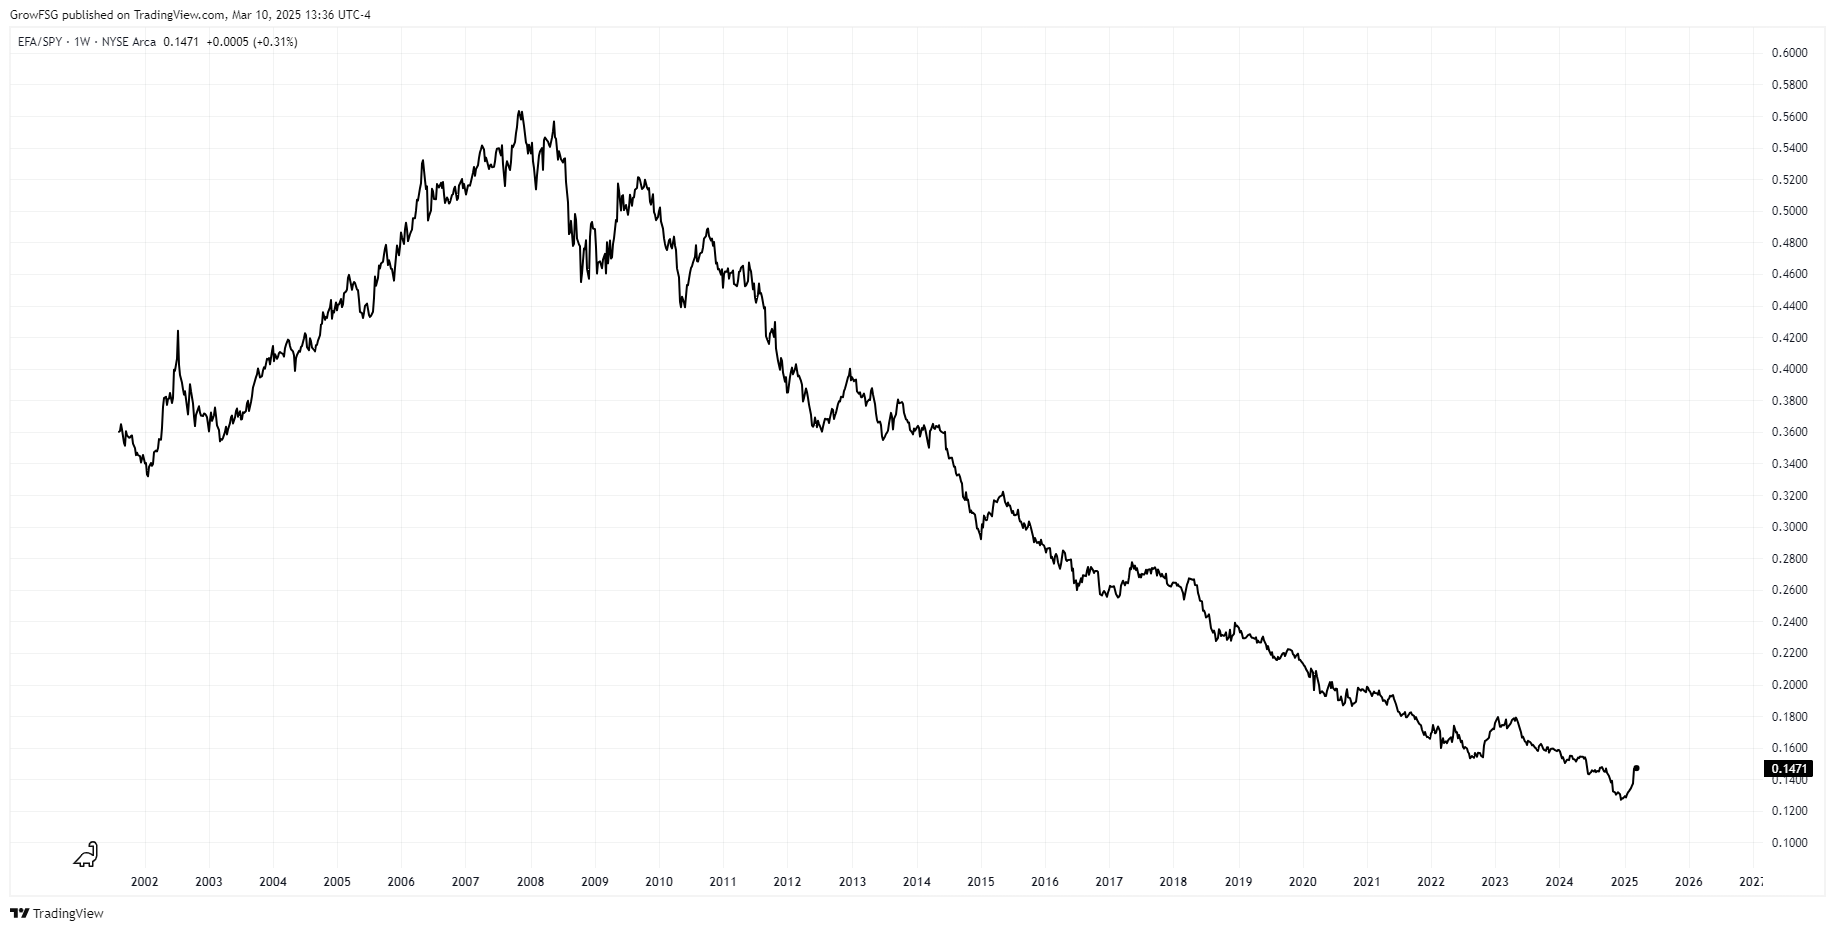
The weekly chart below shows the relative performance of the I fund vs the C fund. The chart shows the price of the I fund divided by the price of the C fund. When the line is trending up, the I fund is outperforming the C fund. When the line is trending down, the C fund is outperforming the I fund. As we can see, the I fund significantly outperformed the C fund from 2002 to late 2007. Since then, relative performance flipped with the C fund outperforming the I fund.
Price never moves in a straight line. What we want to know is relative performance over time. For this, we need to identify the trend. An uptrend is defined by higher highs and higher lows. A downtrend is identified by lower highs and lower lows. From 2002 through 2007, we see consistent higher highs and higher lows. This is an uptrend in the ratio where the I fund is outperforming the C fund. The trend began to change in May 2008, when the May top was lower than the November 2007 top. As the ratio continued lower, a trend change was confirmed with lower highs and lower lows. The downtrend continued into 2025 as the C fund outperformed the I fund.
The ratio has been trending higher since the beginning of 2025 but we have seen this frequently since 2008. Most recently, we see I fund outperformance in late 2022 into early 2023. In every case, the ratio rolls over to lower lows and the downtrend continues. While the ratio has risen sharply in 2025, the long-term downtrend is still firmly in place. What would we need to see to identify a potential trend change? We need a higher low followed by a higher high. We need to see the ratio roll over, put in a higher low, and then rally to a higher high. This would confirm a long-term trend change from C fund outperformance to I fund outperformance.
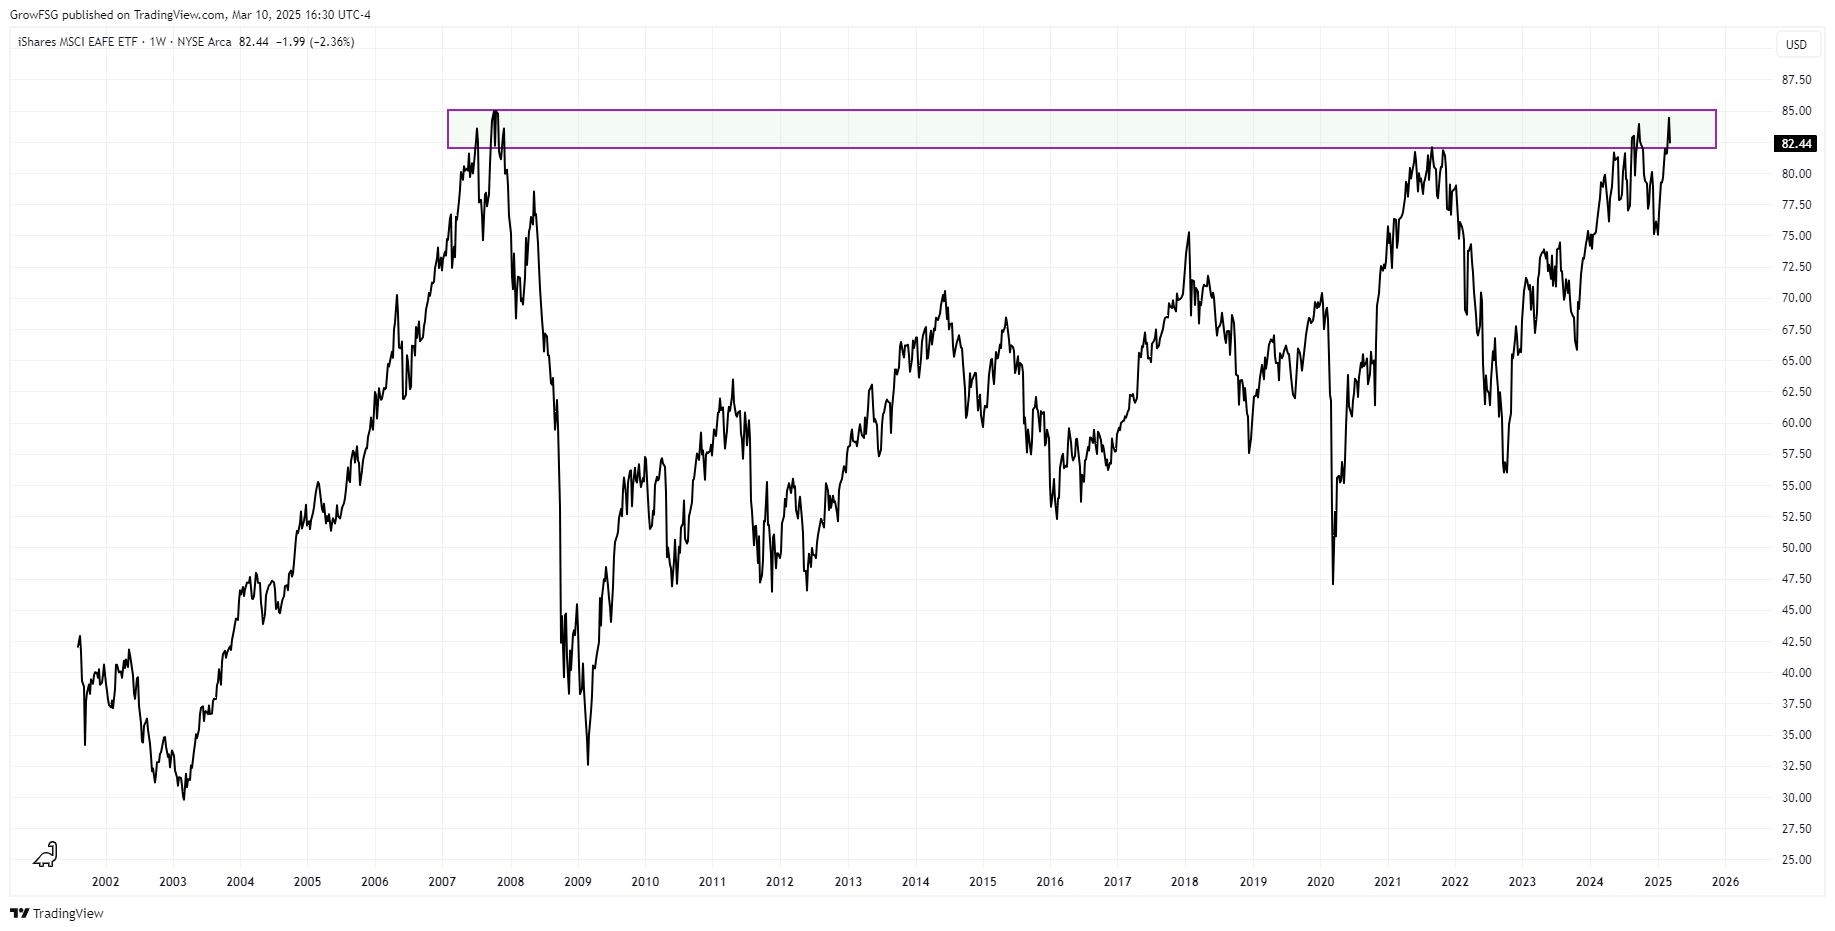
Where is the I fund today? Believe it or not, the I fund has not made a new all-time high since October 2007! While price has trended higher since the 2009 bottom, its gains have been dwarfed by the C fund over the past 16 years. The I fund made a run at its 2007 peak in 2021 but rolled over into the 2022 bear market. It made another attempt in September 2024 and again in March 2025. Previous highs act as resistance while price is below them and support when price is above them. A weekly close above the 2007 peak will be a very bullish sign for continued gains in the I fund.
First, we need to see the long-term performance trend change from C fund outperformance to I fund outperformance. The early 2025 rally in the ratio chart is the first step. We still need to see a higher low and a higher high to confirm the trend change.
Second, we need to see the I fund take out its 2007 top. A new all-time high after 16 years would be very bullish for the price of the I fund going forward.
There are no guarantees in TSP investing but, if/when these 2 conditions are met, the I fund will be a great long-term investment!
Conventional wisdom among most TSP investors is to avoid the I fund. The vast majority believe that some combination of "Buy & Hold" C and S funds is ALWAYS the best allocation. To be fair, it's easy to understand this sentiment. The I fund has underperformed both the C and S funds for well over a decade but this has not always been the case. From January 2002 to October 2007, the I fund more than doubled the gains of the C fund! It's been a LONG time but is the I fund making a comeback? Will the I fund be the outperformer going forward? If so, should TSP investors reallocate to the I fund?
To answer these questions, there are two components. First is relative performance. This is a comparison of the long-term performance trend of the I fund vs the C fund. If the I fund is outperforming the C fund, we want to be in the I fund. Second is nominal gains or losses. If both the I and C funds are declining, the I fund could outperform the C fund just by declining less. If both the C and I funds are declining, we don't want to be allocated to either fund.
We are using the Europe, Asia, Far-East Index ETF (EFA) as a proxy for the I fund, and the S&P500 Index ETF (SPY) for the C fund.
Relative Performance
The weekly chart below shows the relative performance of the I fund vs the C fund. The chart shows the price of the I fund divided by the price of the C fund. When the line is trending up, the I fund is outperforming the C fund. When the line is trending down, the C fund is outperforming the I fund. As we can see, the I fund significantly outperformed the C fund from 2002 to late 2007. Since then, relative performance flipped with the C fund outperforming the I fund.
Price never moves in a straight line. What we want to know is relative performance over time. For this, we need to identify the trend. An uptrend is defined by higher highs and higher lows. A downtrend is identified by lower highs and lower lows. From 2002 through 2007, we see consistent higher highs and higher lows. This is an uptrend in the ratio where the I fund is outperforming the C fund. The trend began to change in May 2008, when the May top was lower than the November 2007 top. As the ratio continued lower, a trend change was confirmed with lower highs and lower lows. The downtrend continued into 2025 as the C fund outperformed the I fund.
The ratio has been trending higher since the beginning of 2025 but we have seen this frequently since 2008. Most recently, we see I fund outperformance in late 2022 into early 2023. In every case, the ratio rolls over to lower lows and the downtrend continues. While the ratio has risen sharply in 2025, the long-term downtrend is still firmly in place. What would we need to see to identify a potential trend change? We need a higher low followed by a higher high. We need to see the ratio roll over, put in a higher low, and then rally to a higher high. This would confirm a long-term trend change from C fund outperformance to I fund outperformance.
Nominal Gains (Losses)
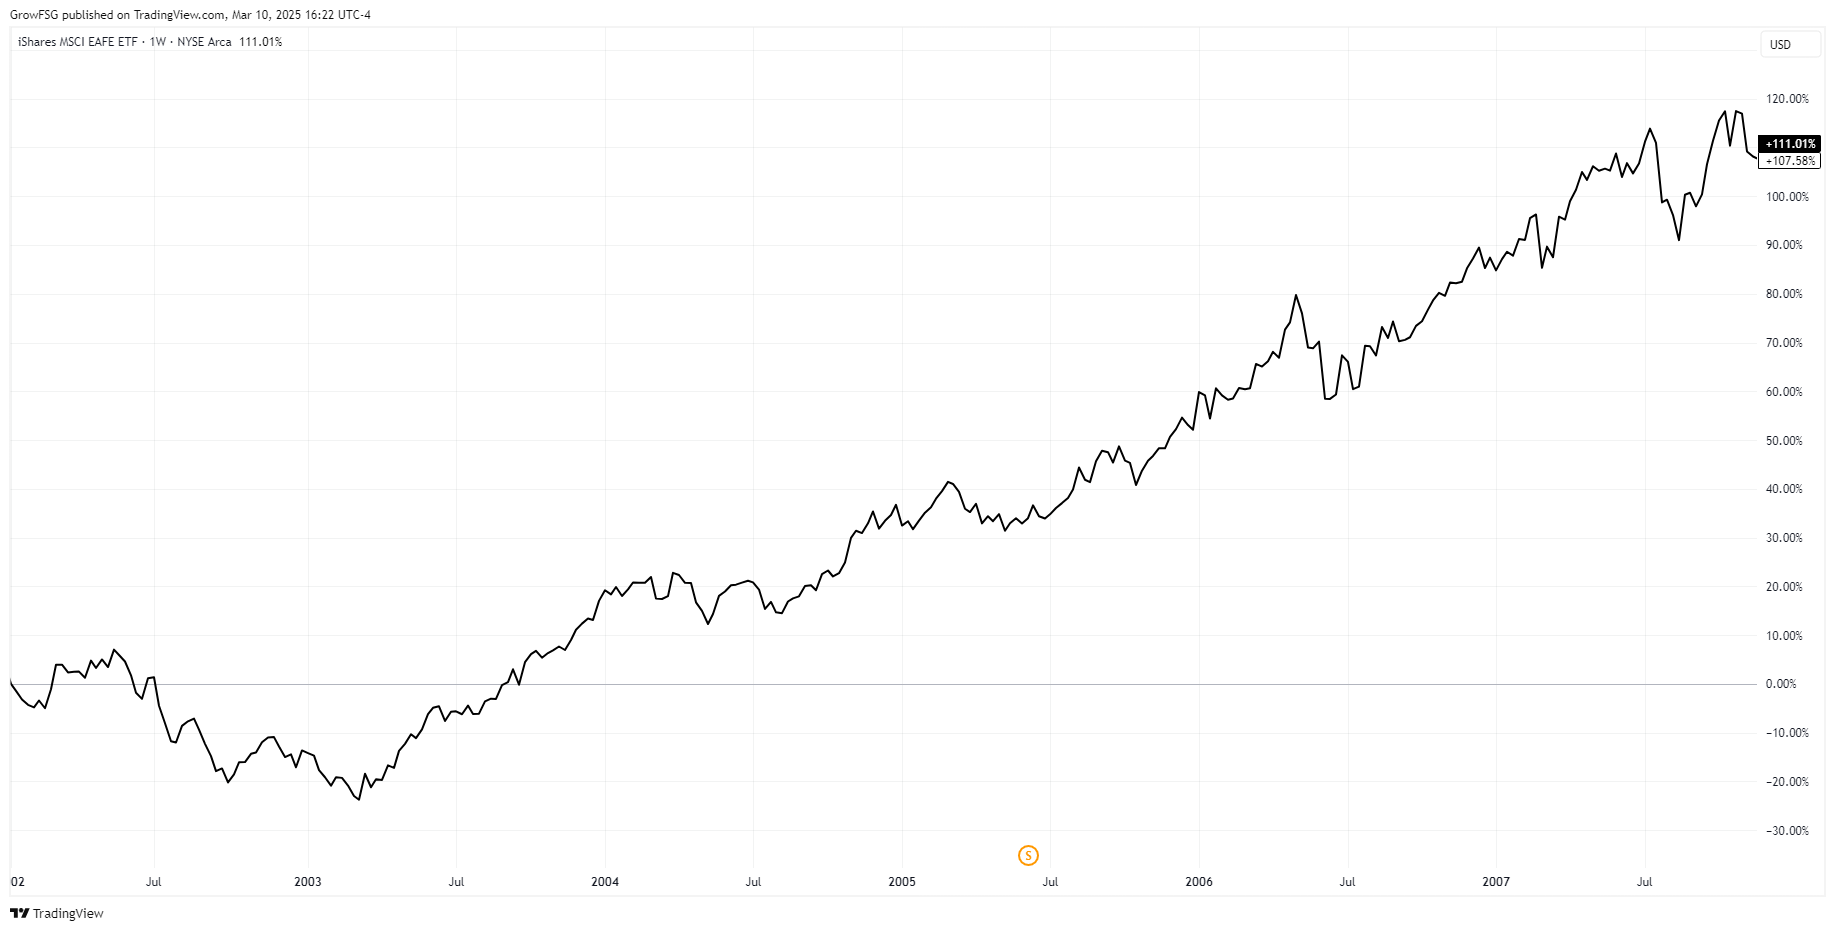
The chart above showed the I fund relative to the C fund where the I fund outperformed from 2002 through October 2007. The chart below shows the performance of the I fund itself during that timeframe. We can see that while the I fund was up over 100% from 2002 to 2007, it was down over 20% from January 2002 to March 2003. Outperformance or not, we do not want to be in a fund that is trending lower.Where is the I fund today? Believe it or not, the I fund has not made a new all-time high since October 2007! While price has trended higher since the 2009 bottom, its gains have been dwarfed by the C fund over the past 16 years. The I fund made a run at its 2007 peak in 2021 but rolled over into the 2022 bear market. It made another attempt in September 2024 and again in March 2025. Previous highs act as resistance while price is below them and support when price is above them. A weekly close above the 2007 peak will be a very bullish sign for continued gains in the I fund.
Bottom Line
The I fund should absolutely be on the radar of TSP investors! We need to see 2 specific conditions before piling into the I fund.First, we need to see the long-term performance trend change from C fund outperformance to I fund outperformance. The early 2025 rally in the ratio chart is the first step. We still need to see a higher low and a higher high to confirm the trend change.
Second, we need to see the I fund take out its 2007 top. A new all-time high after 16 years would be very bullish for the price of the I fund going forward.
There are no guarantees in TSP investing but, if/when these 2 conditions are met, the I fund will be a great long-term investment!

Copyright Grow Investments, LLC | GrowMyTSP.com
Thrift Savings Plan Disclaimer
Neither growmytsp.com nor any of its partners or representatives is in any way affiliated with the United States Government, The Federal Retirement Thrift Investment Board (FRTIB.gov) or the Thrift Savings Plan (TSP.gov), and any service being offered is not sanctioned by the United States Government, the Federal Retirement Thrift Investment Board or the Thrift Savings Plan.