TSP Weekly Newsletter: 28 May 2023


It was an extremely volatile but ultimately bullish week for the C and S funds. The C fund closed the week up 0.32%, S fund up 0.28%, I fund down 2.06%, and F fund down 0.52%. This week’s price action shows why we made the reallocation to the Grow Model Portfolio on 19 May. Generally, all three stock funds move up and down together. It’s not possible to know which of the 3 funds will out-perform on a day to day basis. There are times when conditions make it clear that some funds are riskier than others.

In the 14 May Newsletter, we discussed the chart of the U.S. Dollar and its correlation to the I fund. The chart below shows a breakout of the dollar on 13 May without a corresponding breakdown in the I fund. Over time, there is a very clear inverse correlation between the direction of the dollar vs the I fund. This chart is why we chose not to reallocate into the I fund on 19 May.
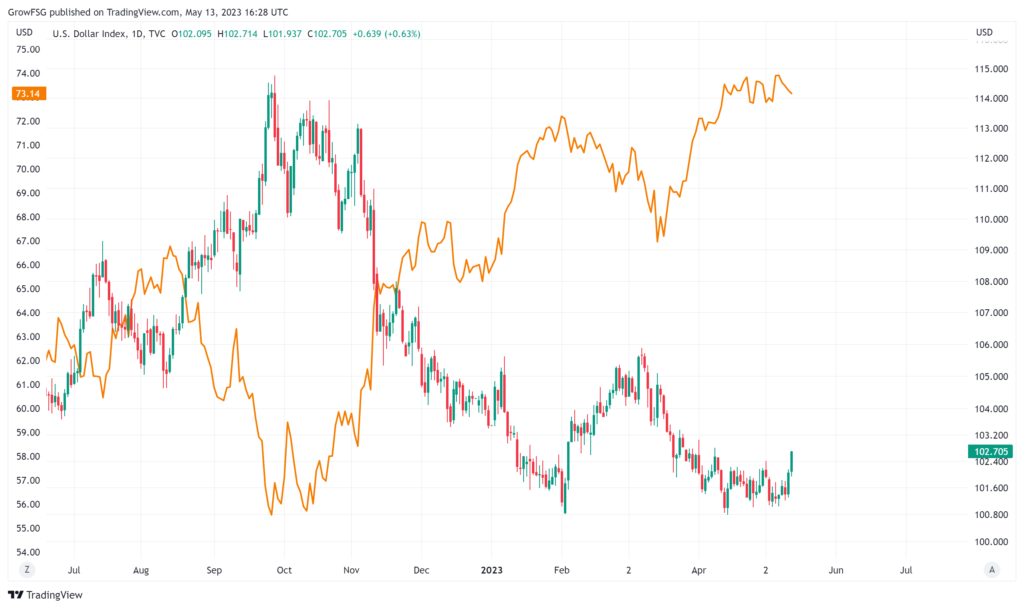
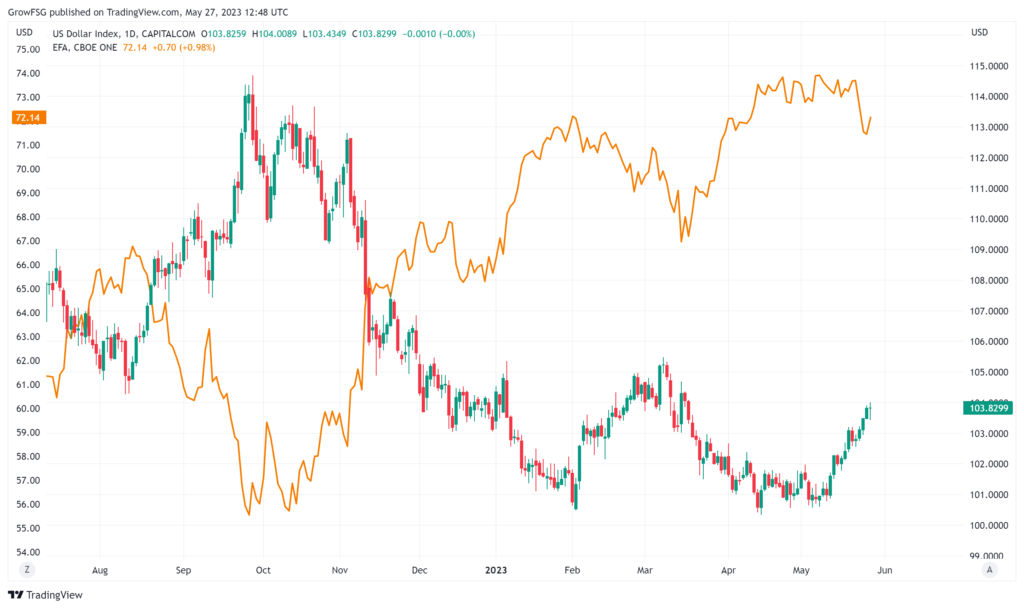
The chart below is Friday’s close. As the dollar continued to rally, the I fund ultimately did roll over. With the dollar approaching potential resistance at 105.50, we need to watch this price level closely. If the dollar reverses at 105.50, the longer term rally in the I fund will continue.

In last weekend’s Newsletter, we looked at the Elliott Wave count of the 10 year yield with respect to the F fund. The weekly, long-term chart is not a timing tool but, it was the reason that we chose not to reallocate to the F fund on 19 May.

This is what that chart looks like as of this week’s close. Interest rates continue to rise and the F fund is continuing its down trend. A close below 96 would imply an eventual retest of the October 2022 low below 94.

What we really have to watch is the F fund relative to the C fund. Both the F and C funds bottomed in March 2020 then rallied sharply. The F fund peaked in August 2020 while the C fund continued to rally into January 2022. Since the top in January 2022, the F and C funds have been moving up and down in concert. This pattern may be reversing as F fund rolled over in April while the C fund continued to rally. This divergence is significant! Either the market is finding its footing OR the F fund is giving us an early warning of the next leg down in stocks.

The TSP Fund Charts

There is a serious fight underway for the direction of the C fund. For now, the bulls are very strong. This week was a great example of investors coming in and buying the dip, driving price above 4200 by Friday’s close. For this rally to continue, we NEED to see more than a handful of stocks driving price higher! We do have slight negative divergence between price and RSI. As price continues to drift higher, RSI is trending slightly down. This is not a great set up going into an important resistance zone. We need to monitor the C fund but, it’s the S fund that’s more important right now.

We have a clear Head & Shoulders topping pattern present in the S fund. The pattern can fail and Friday’s price action gives us some hope but, we are not out of the woods yet! Aside from this ominous bearish pattern, the S fund is important to watch because it’s a much broader index than the C fund. The C fund (S&P500) is made up of 500 companies with about 10 currently driving its price higher. The S fund is made up of the 4500 smaller companies that trade in the U.S. If the S fund rallies off of the neckline, it tells us that the broader market is getting involved in the rally. This is what we really need to see!

It’s possible that we get a gap down through the neckline in the S fund AND a rally in the C fund. If this were to play out, most people wouldn’t see it as they are focused on the C fund. If we see that, it will be a GIANT red flag that the rally since the October low is over for all of the stock funds.

It was a tough week for the I fund. As we explained above, the chart of the dollar gave us fair warning but so did the technical indicators of the I fund. We can see that as price consolidated just below the 74 level, RSI and MACD had already rolled over. Momentum was clearly waning. It was just a matter of time for price to catch up.

The F fund has a similar near term pattern. Price consolidated along the 100 level since March as RSI and MACD began to trend lower. Given the long term Elliott Wave count, it was just a matter of time before the F fund price would break down through consolidation. A close below 96 would be very bearish.

Bottom Line

The market is in rally mode but now is not the time to set it and forget it! The rally will likely continue up to the 4300 level but that is HUGE resistance! 4313 is both the August 2022 high and the 62% retracement level from the October lows. It is the MOST LIKELY level at which this rally fails. Watch price relative to RSI as we approach 4300. If RSI trails off as price continues higher, that will be a giant red flag!

On the other hand, if the S fund can rally, this will tell us that the broader market is participating which makes a continued up trend much more likely.

We hope everyone had a great Memorial Day weekend!

The Grow My TSP Team

Responses

Your email address will not be published. Required fields are marked *

  1. From the broadcast ” A review of the opinions from Buffet”, it was mentioned that the TSP Fund is not like a marketable fund. Can you provide clarity to that statement as well as the comment ” your contributions are buying shares of the funds, and it would not be wise to buy a depreciable asset”.
    I do not undertand that cooment.

    I particpate in the TSP fund for two reasons, first to receive the matching amount from the employer and second the contribution is non taxable thus defering taxable income to future years.

    1. Great question. Your TSP account is divided into 2 buckets. First is the money you already have in TSP. Second is new contributions. In the first bucket, you can reallocate between the funds to maximize gains while minimizing downside risk. You are not actually buying funds when you do this. You are simply reallocating dollar values between the funds. In terms of the second bucket, future contributions, that is when you are actually buying shares. Buying shares in the C fund when the C fund is in a down trend is buying a depreciating asset. When the market is declining, the G fund is the only appreciating asset.
      In terms of matching and tax liabilities, you are absolutely correct. Those are both great reasons to invest in TSP. In addition to that is capital appreciation and minimizing downside risk of your overall account.

  2. I joined today and saw the May 19th allocation alert (including 30% in C and 50% in G fund). My allocation has been 50% in C and 50% in S effective 28 May 2023 in anticipation of the debt ceiling deal. Would you recommend for me to move 50% to G fund until you issue the next allocation alert?

    1. First off, welcome aboard!

      Unfortunately, we can’t give personal investment advice. Your question depends completely on your own personal circumstances and risk tolerance. We explained in the Alert Analysis on 19 May and the Market Update on 25 May that the market is poised to move higher. We would expect significant resistance at the 4300 level. There has been very little forward progress since mid-May but, the market has not broken down to give us a sell signal either.
      Given that any reallocation you make now will be your first for June, you would still have one more reallocation for the month to increase your stock position. Lightening up on stocks at this point is a practical decision. Maintaining 100% stock exposure is a risk at this point but, if the market rallies, you will be in a much better place. It really comes down to your personal risk tolerance. Makes sense?