
TSP Weekly Newsletter
On the Podcast two weeks ago, we discussed trading strategies from Jeffery Hirsch at StockTradersAlmanac.com and Larry Williams at IReallyTrade.com. If you haven't seen that Podcast, go back and watch it on YouTube. There is a ton of still timely info in there! In this Newsletter, we're going to drill down into the "Best Months Seasonal Switching Strategy" from Stock Trader's Almanac.
The strategy is very simple and has its origins in the Wall Street adage, "Sell in May and go away!". For more on the history of this famous Wall Street lore, here's a great article. The idea is that Wall Street traders go on vacation during the summer, resulting in light trading volume that creates a summer doldrums for stocks. While summer vacations aren't what they used to be, the tendency persists.
This is a great strategy to follow if you don't watch the market often. It's a seasonal, historically validated strategy that consistently beats a "Buy & Hold" strategy over time. There are, however, some obvious downsides. It's based on historical analysis, not what's happening currently in the market!
The StrategyOn an historical basis, the best 6 months to be in the S&P500 are November through April. The worst 6 months are May through October. That's the basis of the strategy. It is executed using a MACD cross and is confirmed by the Dow Jones Industrial Average.
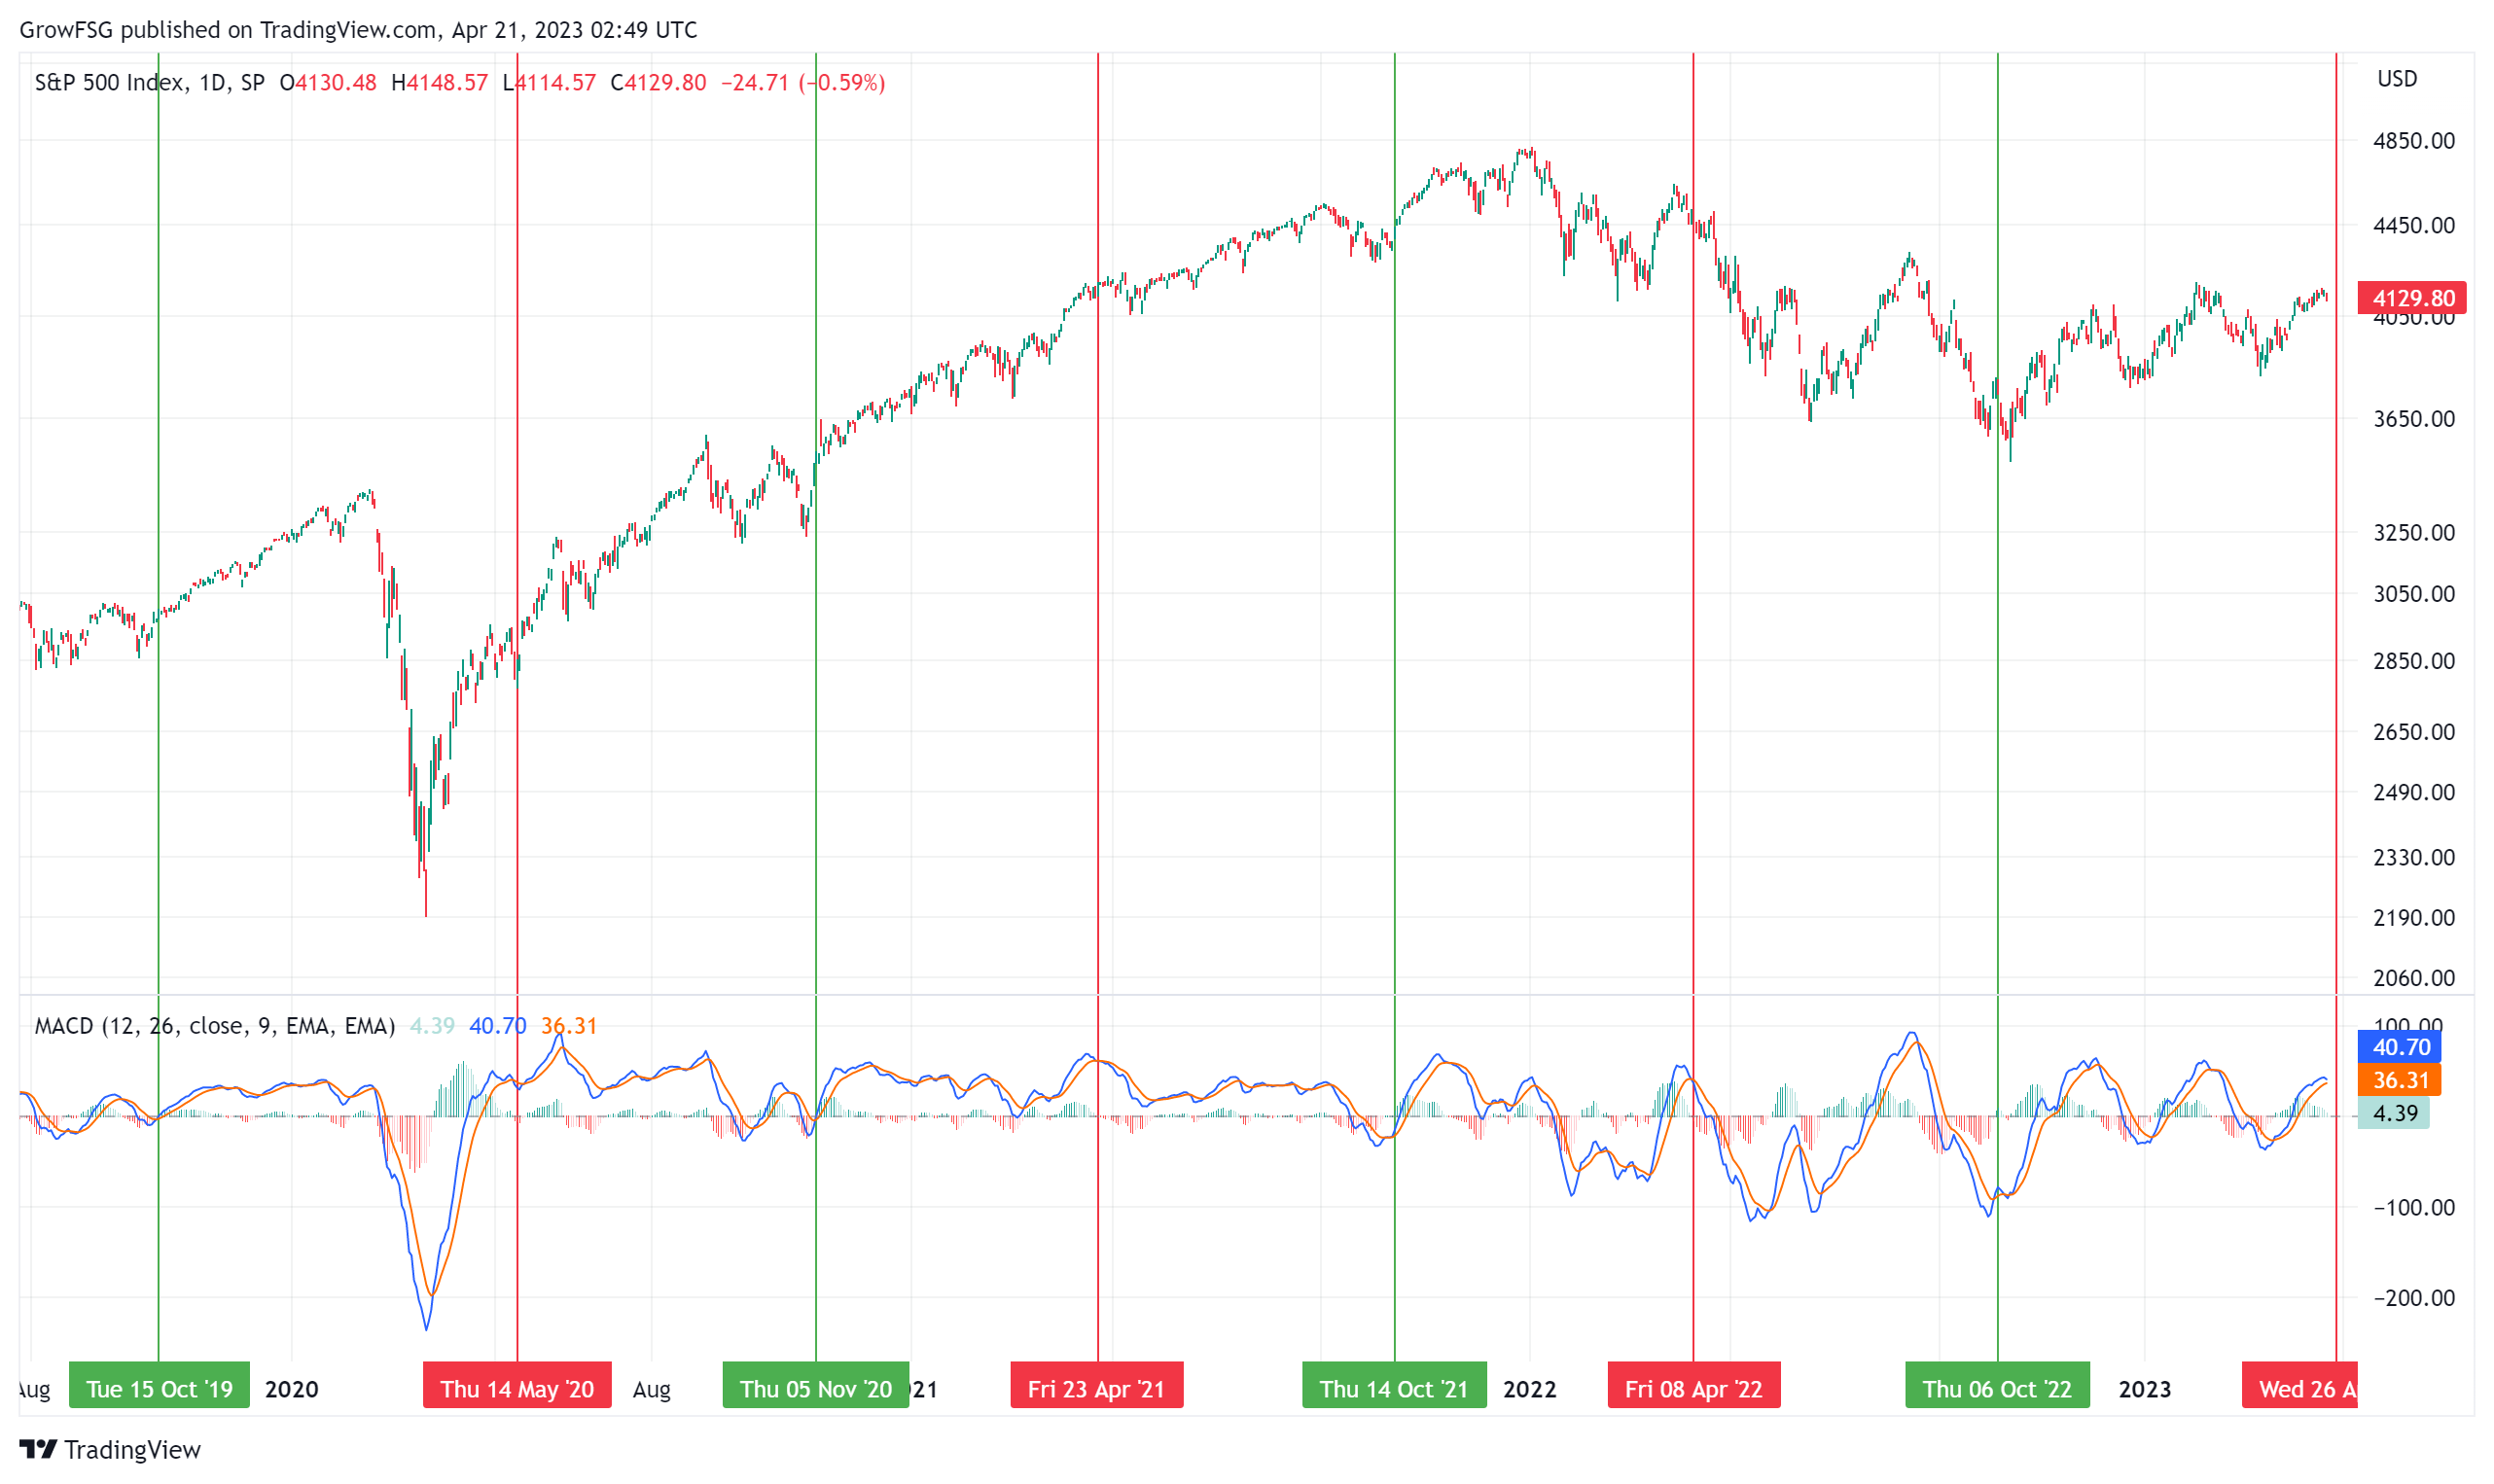
The daily chart of the C fund below shows the past 7 buy/sell triggers for the strategy. Because November is the first of the best months, the first positive MACD cross after 01 October is the buy trigger. Because May is the first of the worst months, the first negative MACD cross after 01 April is the sell trigger. A sell trigger for the worst 6 months of 2023 is imminent...
The strategy begins with buy/sell triggers in the S&P500 (C fund). It is confirmed by the same trigger in the Dow Jones Industrial Average. The DJI chart below shows the same timeframe as above. Triggers tend to happen within a few days of the S&P500 triggers. Both need to be in place for a reallocation.
