
TSP Weekly Newsletter
The market can, and often does, rally during times of geopolitical turmoil. It is very possible that we are in the midst of a Melt Up, at least in the short term. If that is the case, we absolutely want to be on the right side. The alternative is a market collapse. While sideways movement is always a possibility, the extremes in interest rates, geopolitical, and domestic tensions, make sideways price movement unlikely.
In last weekend's Newsletter, we focused on long term Elliott Wave possibilities. This week we'll do a short term analysis of each fund and draw clear lines in the sand.
The C Fund
The 200DMA (day moving average) line has been a clear support and resistance indicator going back to 2012. It's clear from the daily chart of the C fund that we do not want to be in the C fund when price is below the 200DMA. Price found support at this level and rallied off it last week. History suggests that price should continue to move higher. If the 200DMA line fails, we know there's safety in the G fund.
Given that we have currently have support at the 200DMA line, a buy trigger in place as of this week, and very strong seasonal tailwinds, my primary short term Elliott Wave count is below. If wave 4 holds as the low of this correction, wave 5 could take price to new all-time highs by the end of 2023. If wave 4 does not hold, this count is invalidated. A pull back to anywhere above wave 4 would be painful in the short term but, as long as wave 4 holds as the low, this count remains as primary with significant upside potential.

My alternate count is below. As we explained in last weekend's Newsletter, this is the Primary count for most Elliott Wave analysts... This count is CONFIRMED on a daily close below 4200. If that happens we will likely be in the midst of a major market collapse.

The S Fund
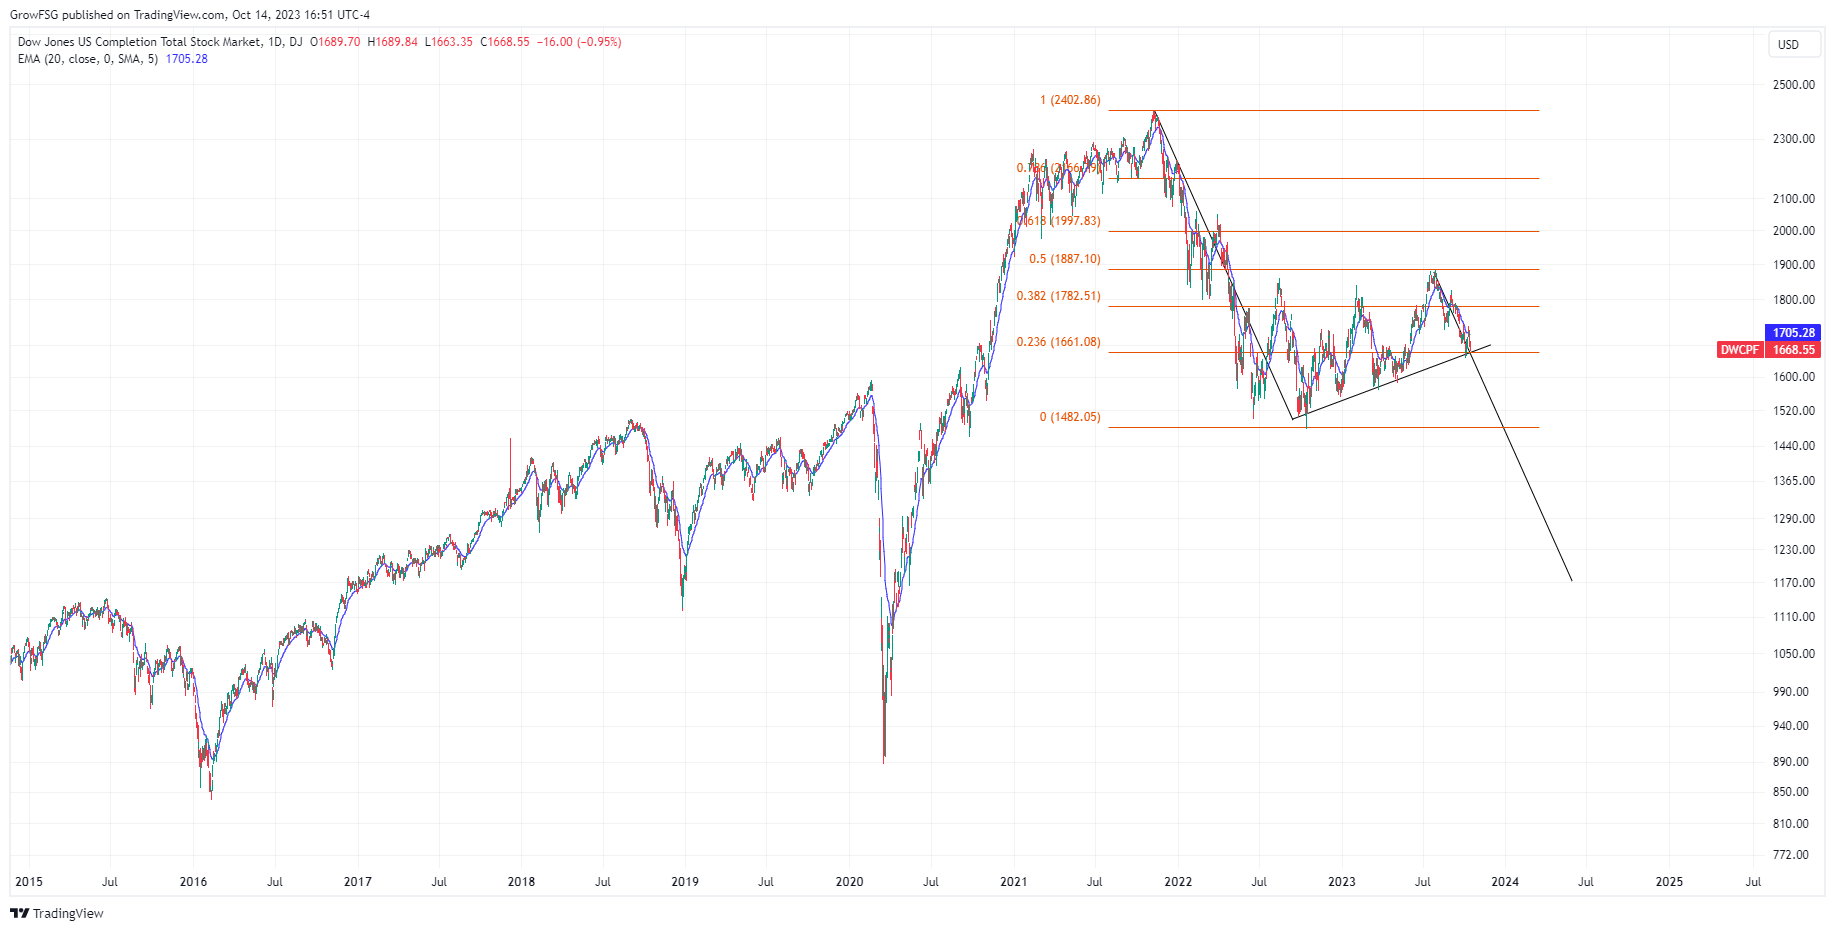
The S fund chart is much weaker than the C fund chart. While the C fund has rallied significantly off the October 2022 lows, the S fund has really under-performed. Price has essentially put in a triple top between 1800 and 1860. Since breaking below the 20DMA line in early August, the S fund has been under pressure and is in a clear down trend channel. The best hope is that price finds support at the well established upward sloping trendline than began at the October 2022 low. A daily close below 1650 is most likely the nail in the coffin for the S fund. At that point, the next downside target would be 1500ish.
The long term view of the S fund is much more problematic. The Fibonacci retracement shows that price recovered exactly 50% of its losses from the top in 2021 to the bottom in 2022. If support at the upward sloping trendline fails, the AB-CD correction pattern projects the S fund to bottom at around 1170.
I Fund
From this relatively short term perspective, the I fund appears to be in a slow rollover. After hitting upside resistance for months at 74, the I fund now cannot string together a few days above its 20DMA line. We have a recent bearish ADX cross (red line above green line), RSI rejected at the 50 line and CCI rolling over at the 0 line. The decline in the I fund continues...
A longer term chart of the I fund gives us a different perspective. There have been three significant bull markets in the I fund since 2012. The top of the first in 2014, top of the second in 2018 and top of the third in 2021. The bear market after each peak had an initial leg down, followed by a recovery rally to the 0.786 Fibonacci retracement level before rolling over to new lows. IF the pattern continues, price should take out the 2022 lows at 54.50.

F Fund
Like the I fund, a short term chart of the F fund shows a long, slow roll over. We see consistent lower highs and lower lows, ADX sellers trending higher as buyers trend lower. The most concerning aspect of this chart is that price has taken out the October 2022 lows. That was the last obvious support level for the F fund.
A long term chart of the F fund shows a much more important picture. Anyone who began investing in the F fund at its inception in 2003 is now significantly underwater. The F fund is rapidly approaching the extreme lows of 2008! On the positive side, we have a very clear Elliott Wave pattern to the downside that is almost complete. The recovery rally from this historic bear market in the F fund could take price back up to 113 (the 0.786 retracement level) or higher.

Bottom Line
Macroeconomic and geopolitical conditions are horrible. Economists are divided in their forecasts for the next 6 to 18 months. Many believe that the U.S. will be in recession by the end of 2023. Other believe that Q2 or Q3 of 2024 will likely be when recession hits. There is also a group of analysts that focus on seasonality. They are forecasting a very strong Q4 for stocks. We will have to wait and see how this plays out...
For our purposes, the 200DMA and the 4200 level of the S&P500 (our C fund) are a critical. We don't want to be in the stock funds when price is below the 200DMA line. We also don't want to get whipsawed out of the stock funds in the midst of a Q4 rally. Now is NOT the time to get complacent!
Have a great week!
The Grow My TSP Team
