
Alert Analysis
As of today's close, the market reversed the breakouts that precipitated the Alert on 12 July. In this Alert Analysis, we'll show the breakout charts from 12 July and the current charts for each of the TSP stock funds and the Dollar. At the end, we'll look at a weekly chart of the C fund and discuss reallocation decision options using a weekly rather than a daily reallocation decision process.
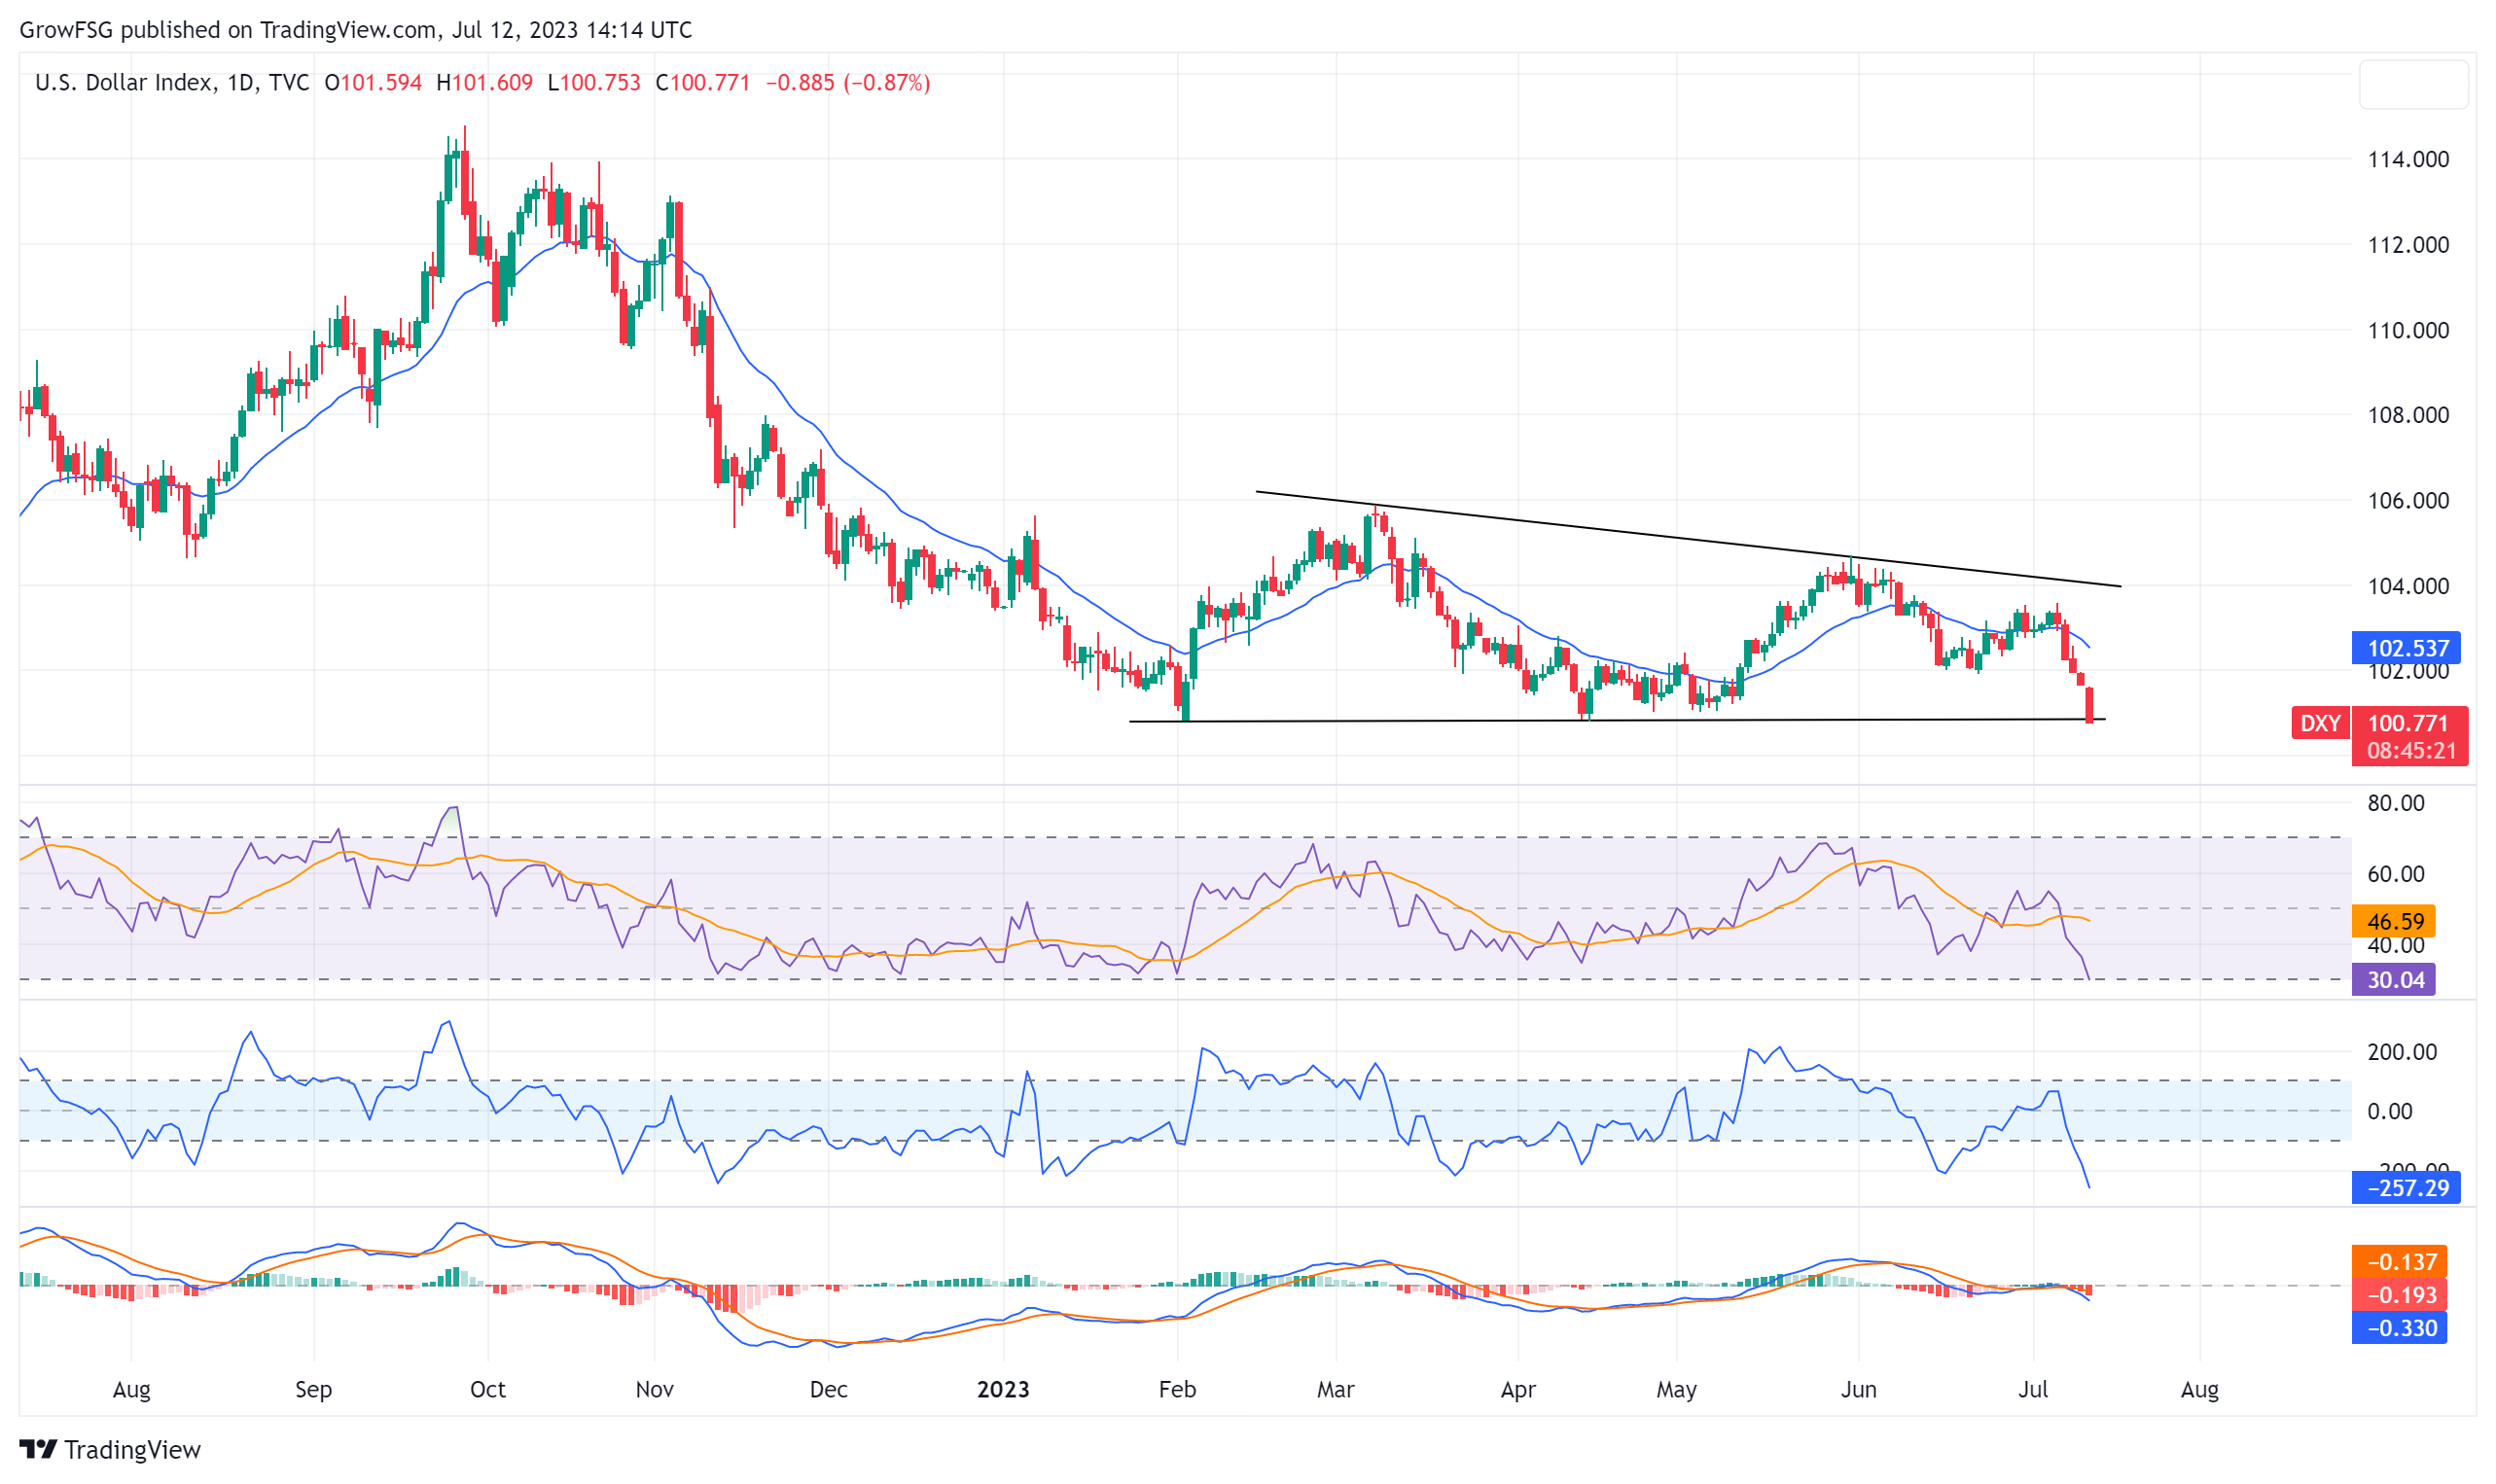
The chart below shows the U.S. Dollar on 12 July 2023. As of that day's close, the dollar had broken down through a 5 month triangle consolidation pattern. Triangle consolidation patterns generally resolve in the direction of the prior trend; in this case, down. The expectation was that the dollar would continue lower following this breakdown. A falling dollar is a tailwind for stocks which was a significant part of the 12 July reallocation decision process.
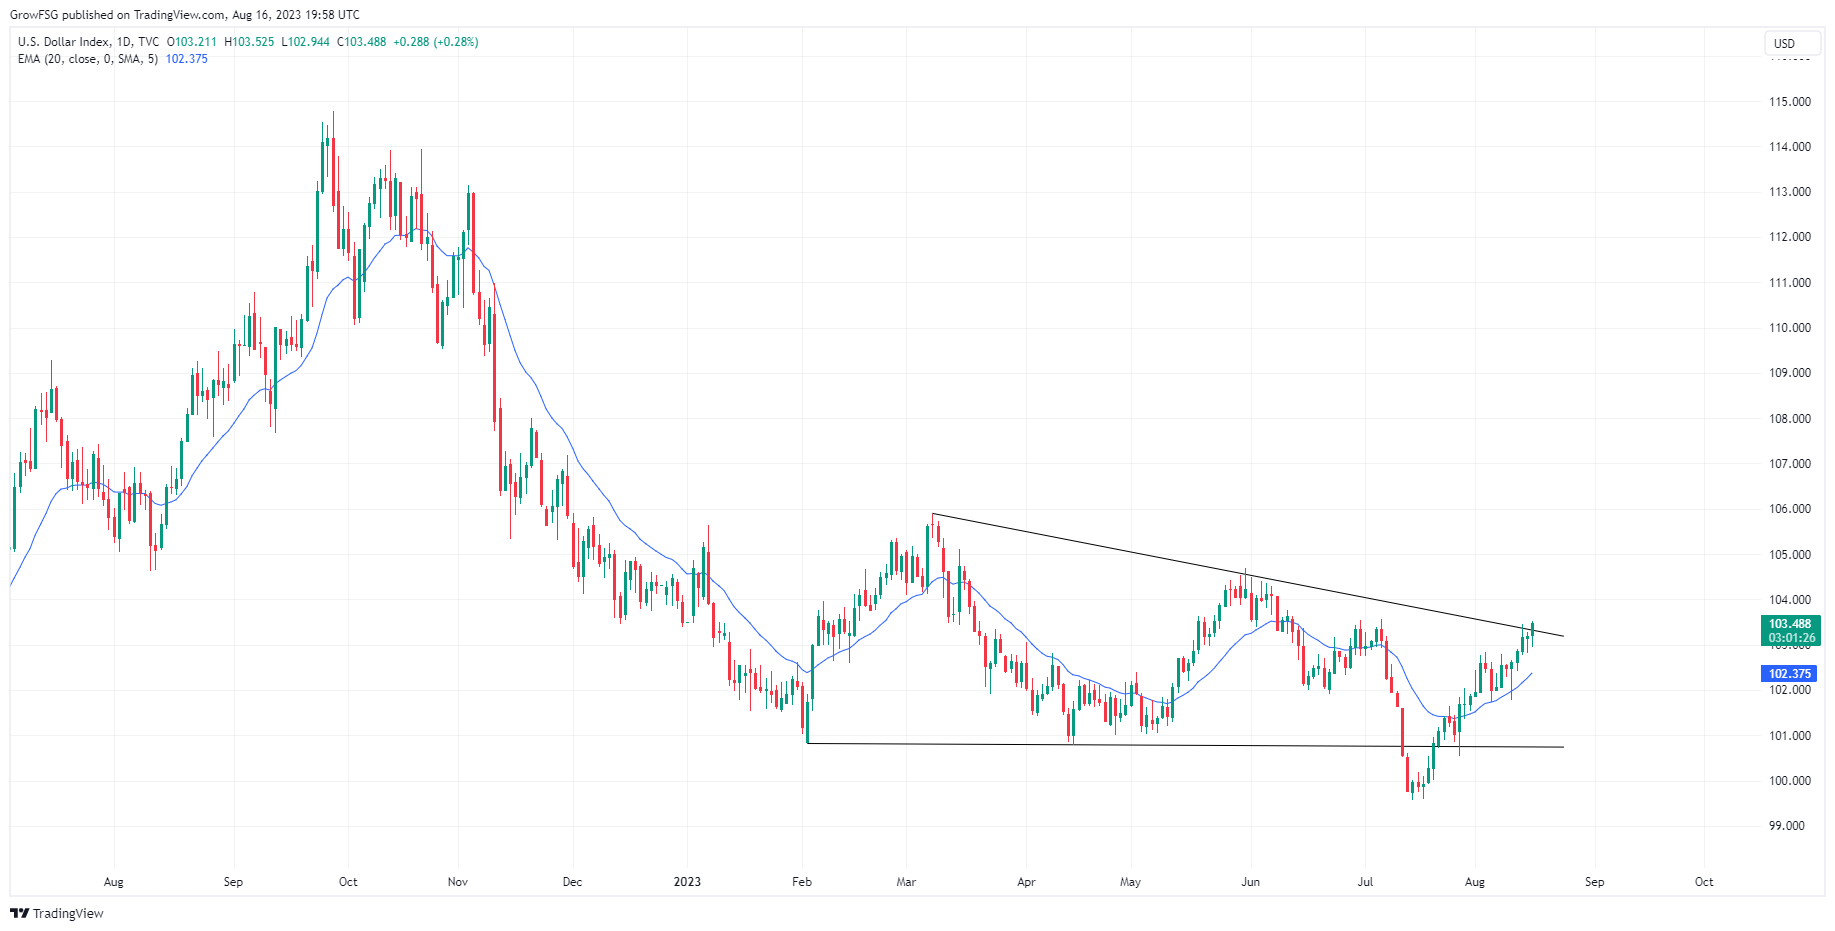
The chart below is the dollar currently. The 12 July breakdown quickly reversed and the dollar has broken above the upper triangle consolidation line as of today's close. This breakout implies that the 12 July breakdown was a head fake and the dollar is likely to move higher. This is clearly a headwind for stocks.
The chart below shows the C fund on 12 July. The C fund had broken out of a one month consolidation with RSI, CCI and MACD supporting a move higher. The red dotted line was the line in the sand if the initial breakout failed.

This is the chart of the C fund as of today's close. Price did move higher following the breakout but rolled over in early August. As we've discussed in recent Market Updates and Newsletters, IF the bull market that began in October is to remain in tact, price should find support at the 50DMA on any pull back. As of today's close, the 50DMA line is violated, RSI is below 50 and falling, CCI below 0, and MACD crossed to the downside.
While it is possible that price could find support, possibly at the red dotted support level, the odds of a more sustained down trend are much more likely after today's close.

The S fund chart from 12 July shows a gap up through the long term triangle consolidation with all technical indicators supporting higher prices.

The chart of the S fund as of today's close shows that the breakout ultimately failed. Price is now back in the trading range. We could see support at the July low of 1720 or the lower trend line at 1640.

The 12 July chart of the I fund shows a gap up through the 20DMA, RSI above 50, CCI above 0, and MACD cross positive.

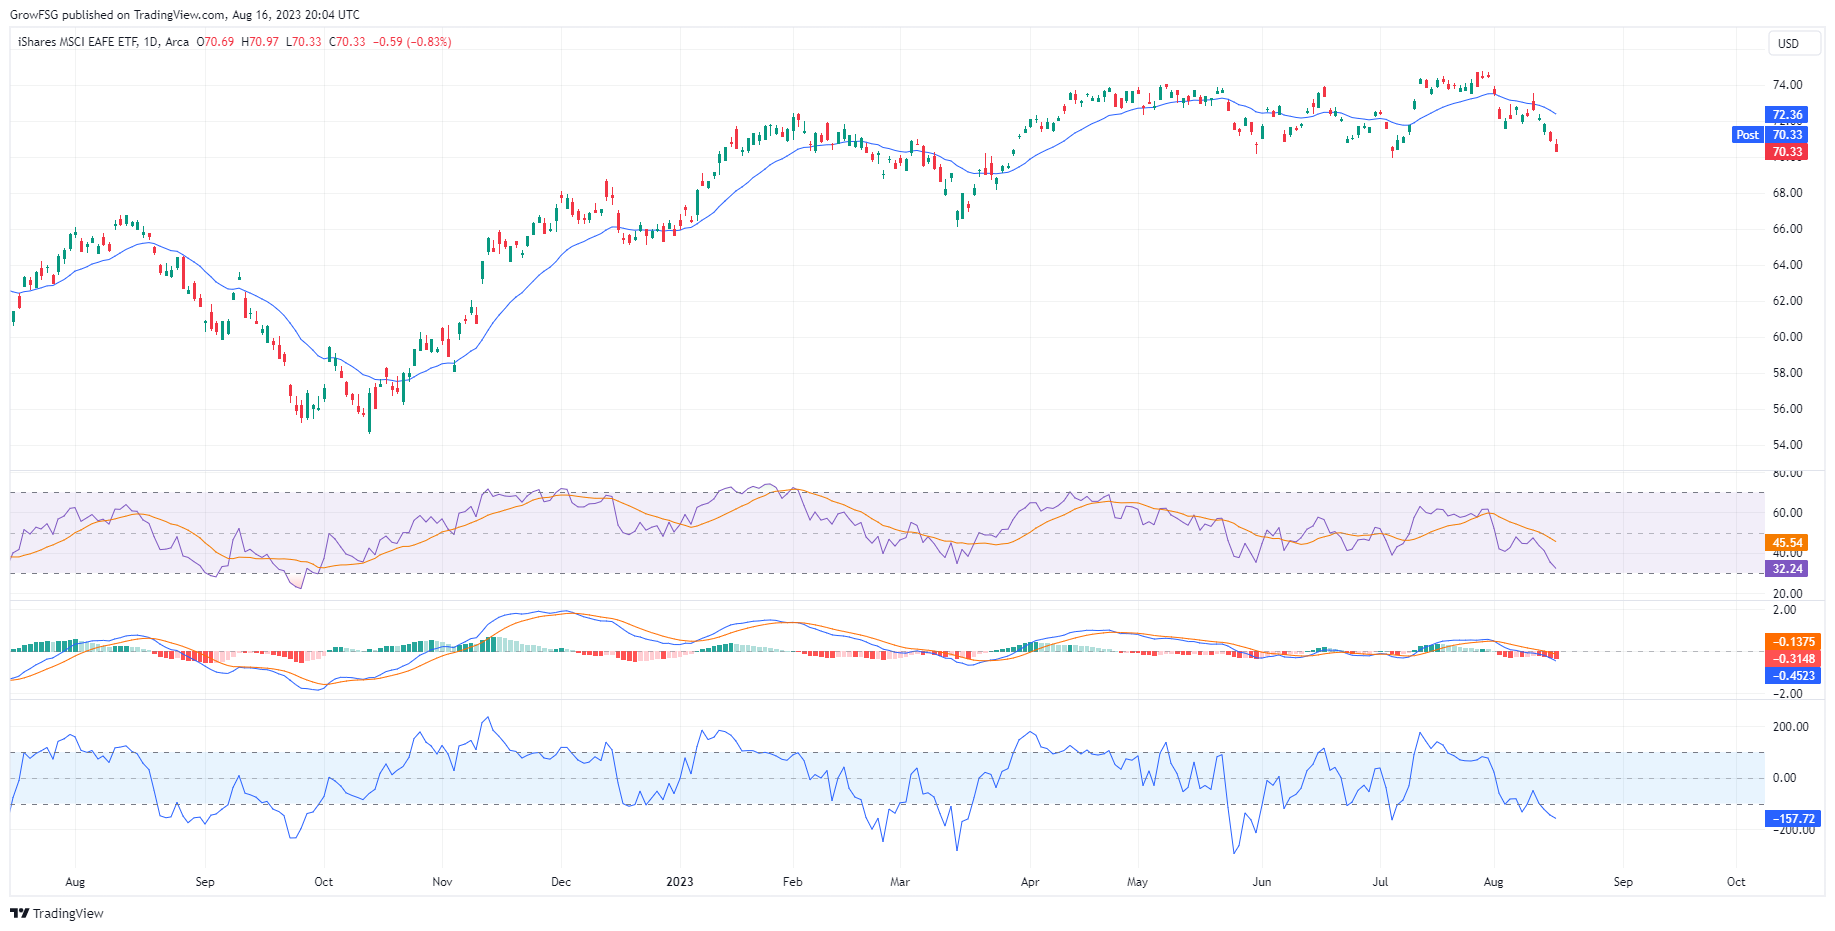
While the breakout was initially successful, the I fund could not break through long term resistance at 74. Ultimately, the I fund rolled over and is now at the lower end of the trading range between 70 and 74.
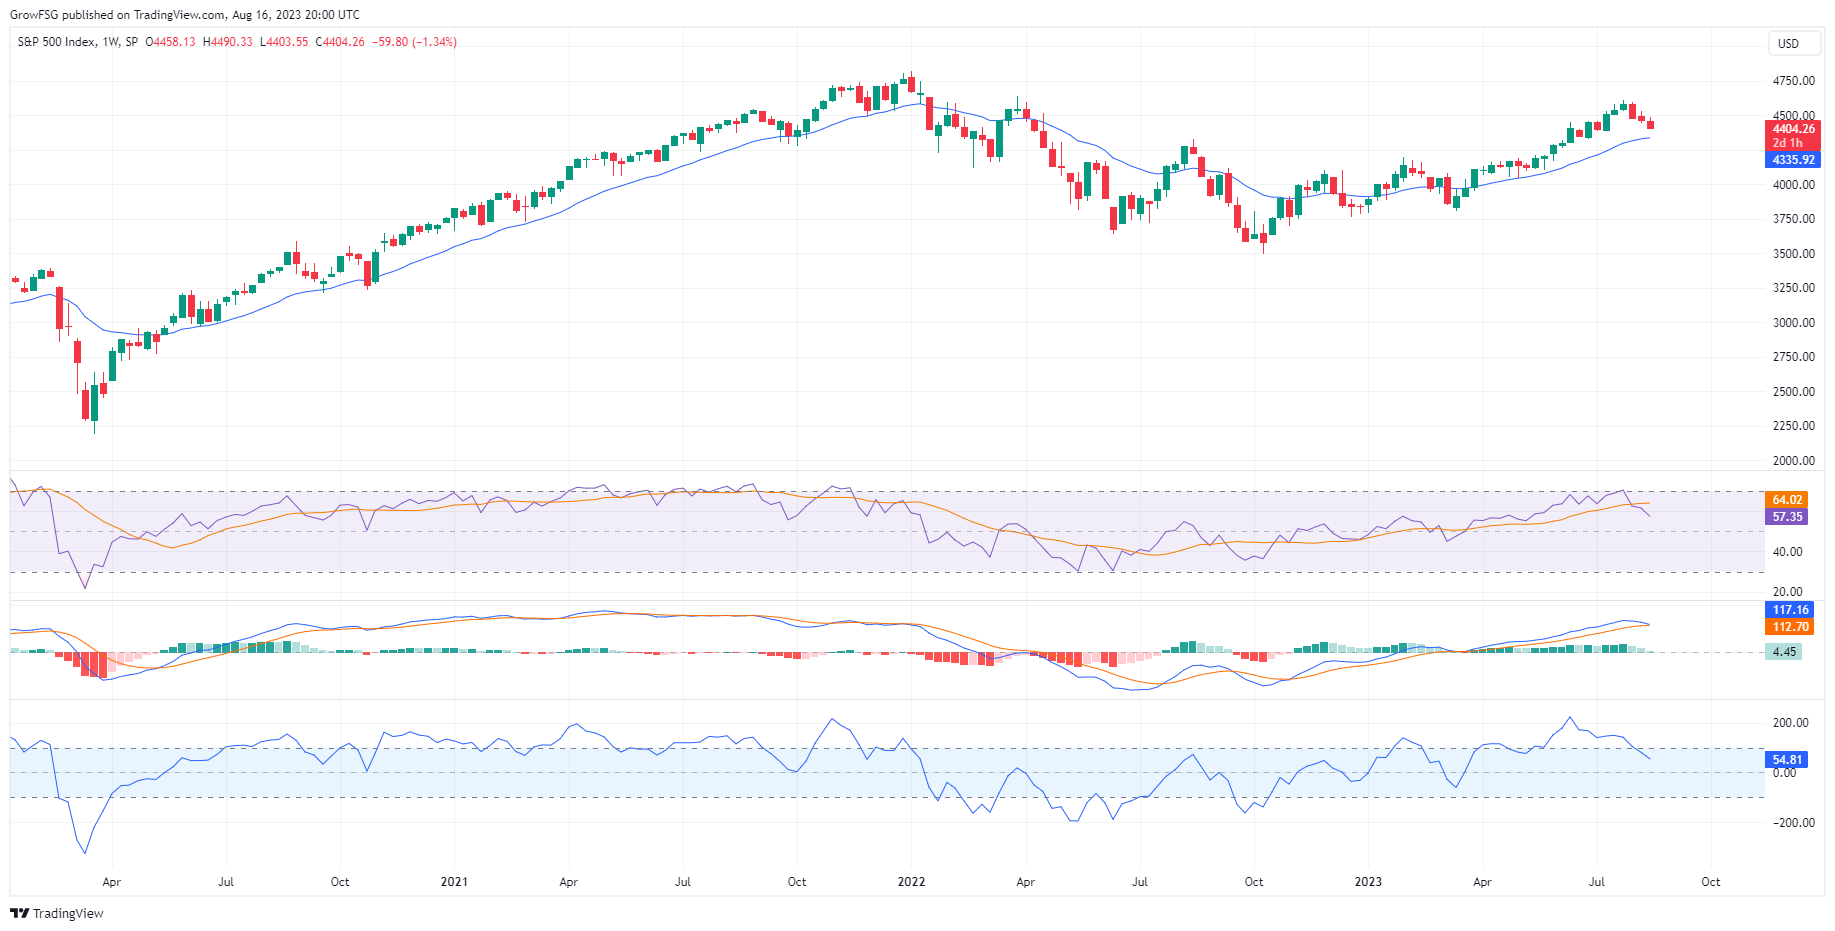
On a weekly basis, the C fund is still above its 20WMA, RSI is above 50, CCI above 0, and MACD is positive. We do not yet have a sell trigger on a weekly basis. Following the Covid crash, the bull market from mid-2020 through 2021 was supported by the 20WMA. IF the current bull market is to continue, price will very likely find support at the 20WMA on the current pull back.
This is the emotionally difficult part of managing your TSP account on a weekly basis. As of last week's close, price was approximately 2.5% below its recent weekly high. The 20WMA sits 5.3% below the recent weekly high. That is the potential draw down before making a reallocation decision on a weekly basis.
This weekly chart shows that the majority of significant losses happen below the 20WMA. While accepting short term drawdowns can be difficult, managing TSP on a weekly basis requires that level of consistency.
Bottom Line
The bull market that began in October 2022 took it's first significant hit today. A daily close below the 50DMA does not necessarily derail the long term rally but, history shows that losing support at the 50DMA is the first step toward a more sustained correction or the return of a bear market.
If the rally resumes, price currently sits 1.8% below the 20DMA line. That is the opportunity cost to the upside in the C fund. The potential downside remains to be seen. Either way, the next Alert will come with the next buy trigger. Until then, we'll watch and see how this correction unfolds.
November and December are seasonally very strong months for all 3 stock funds. Baring the resurgence of the bear market, we will be looking for a buy trigger in early Q4.
New Grow Model Portfolio Allocation: 100% G Fund
---------------------------------------------------------------------------GrowMyTSP.com does NOT provide personal investment advice. The Alert and Analysis are designed for you to make your own reallocation decisions based on your personal circumstances and risk tolerance. This Alert analysis details the current allocations within the “Grow Model Portfolio”. You can follow along with these allocations or use this information to make your own reallocation decisions.
