
Using Price Charts To Manage Your TSP
The S&P500 (our C Fund) rallied over 80% from February 2020 to February 2025. Over the same time period, C fund investors experienced six double digit declines. This has been the most volatile 5-year period since the bottom of the Great Financial Crisis in 2009.
TSP investors are understandably on edge. With periods of rapidly rising stock prices interspersed with even faster declines, how can TSP investors stay on the right side of the market?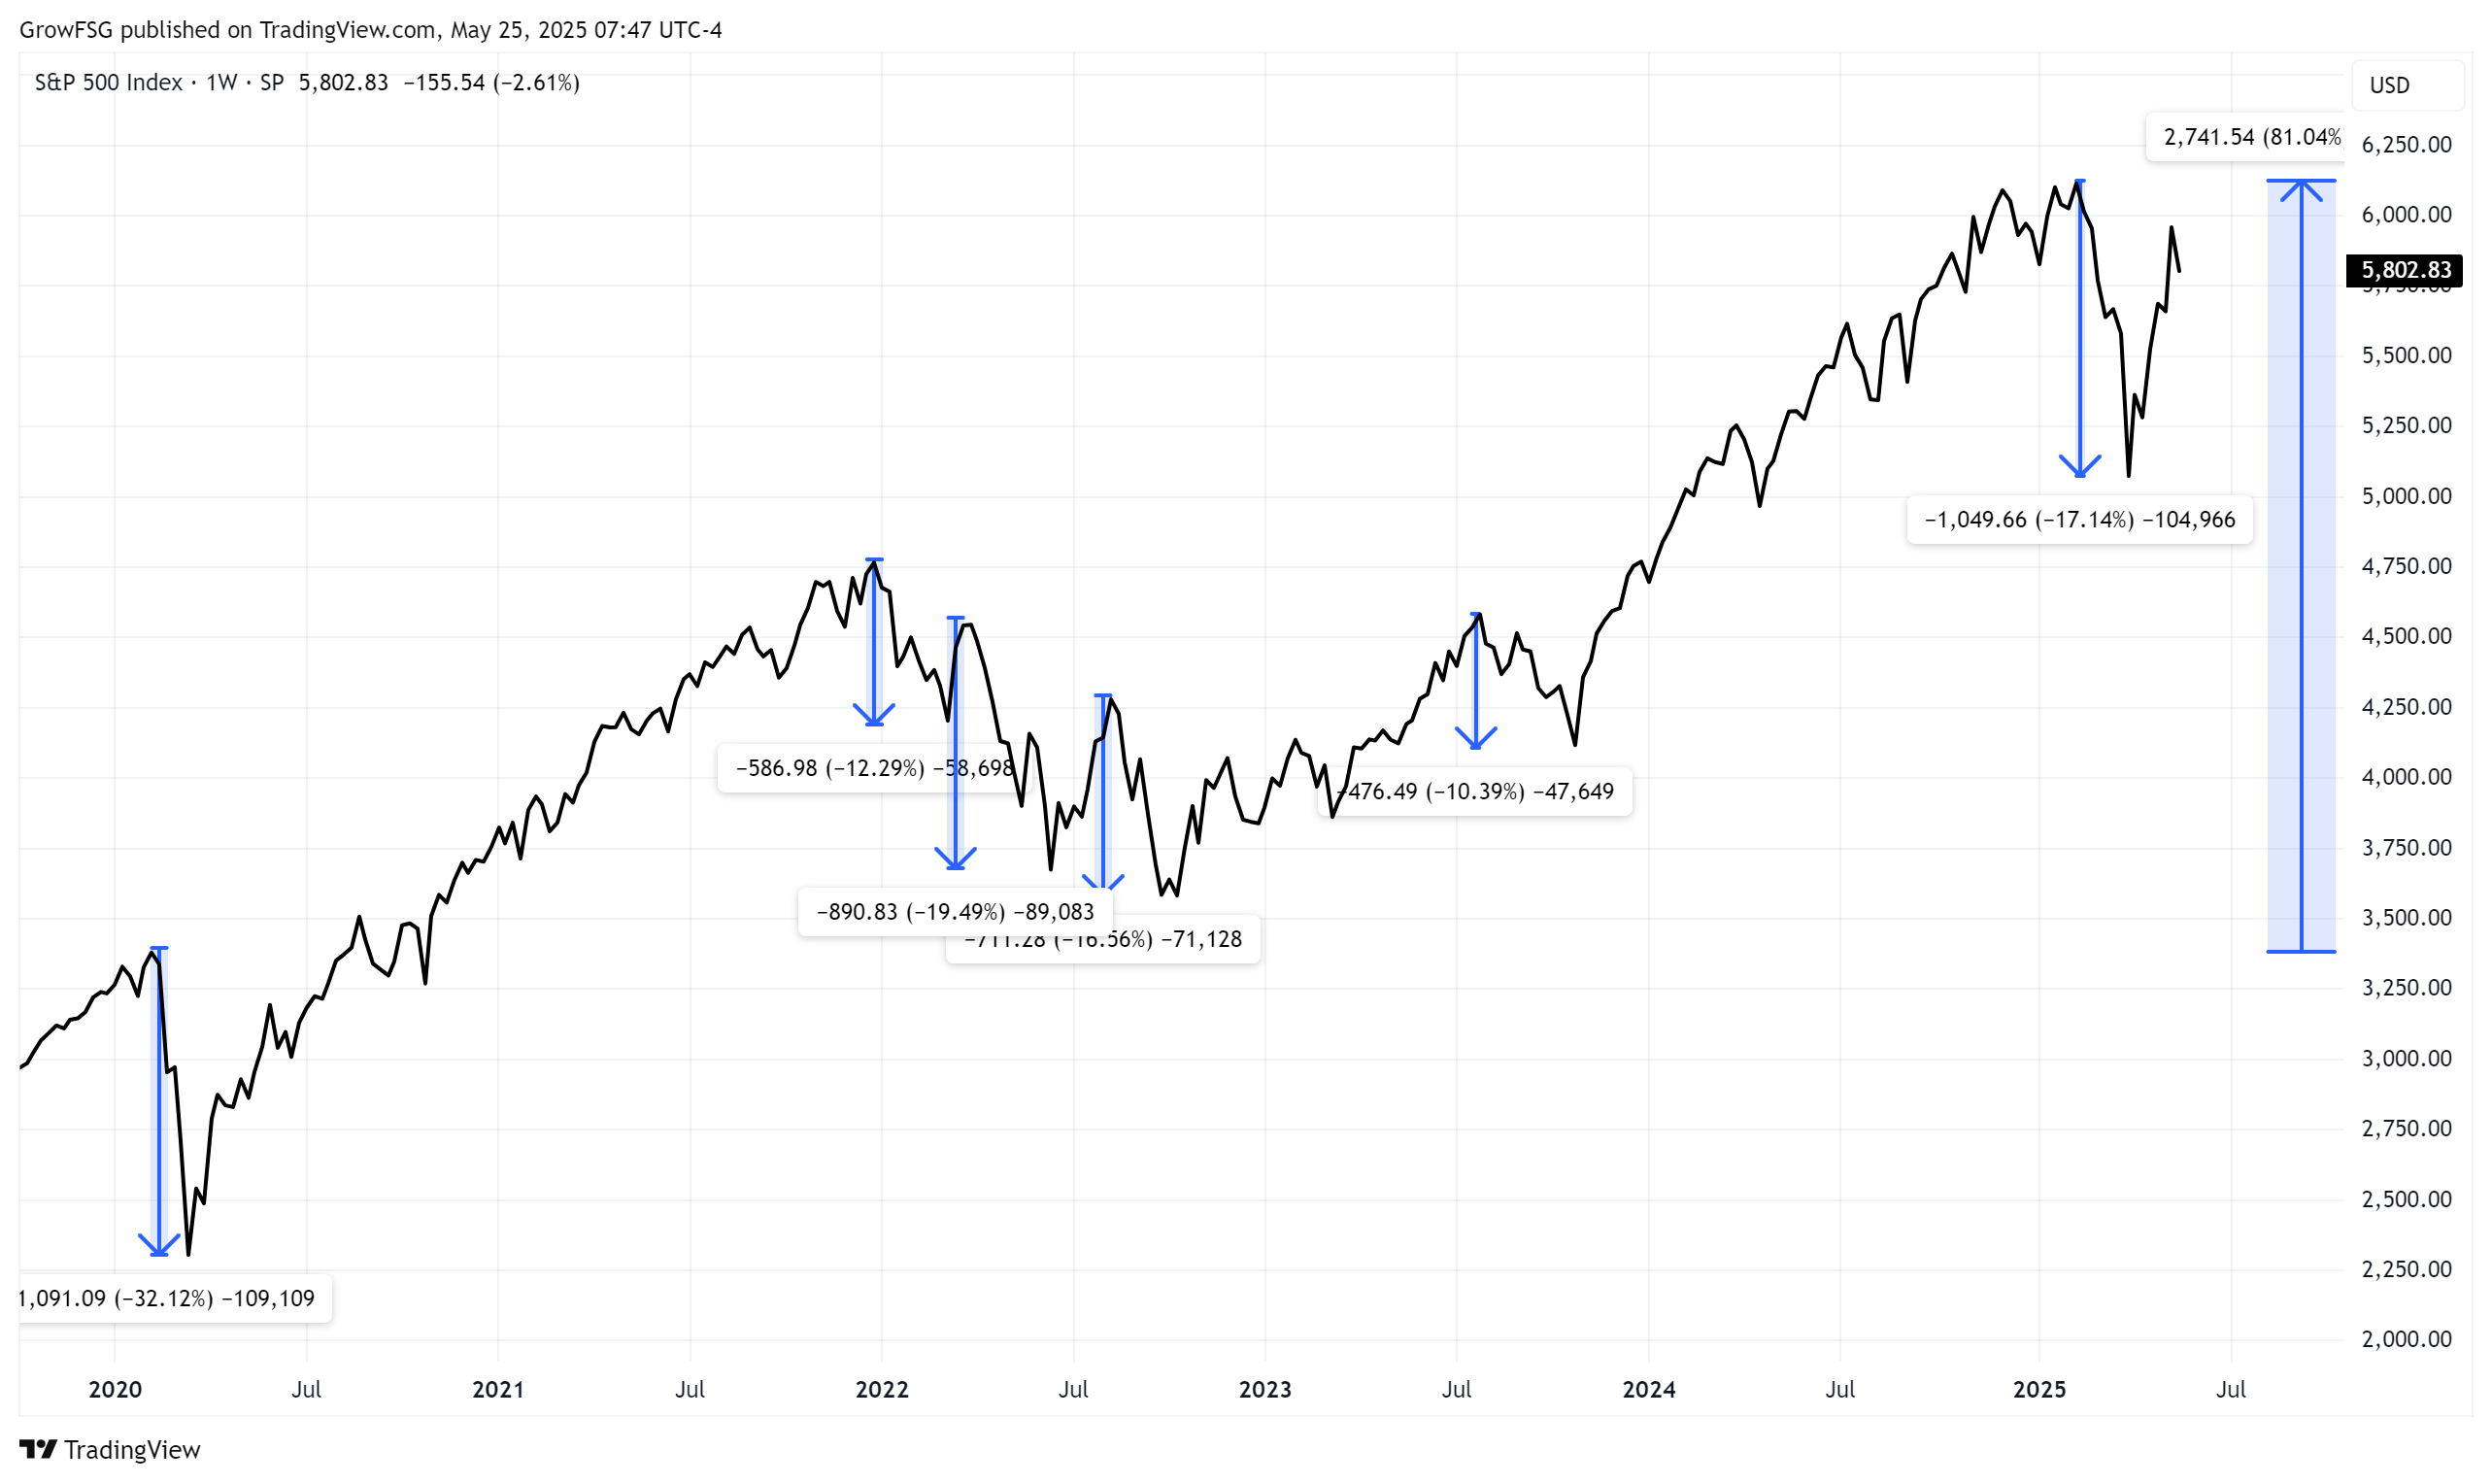
For Buy & Hold investors, market volatility is not an issue as they remain fully invested while riding the ups and downs. For active investors, this level of price volatility can be extremely frustrating.
Many active investors make reallocation decisions based on current news. Certainly any news out of the White House, Congress or the FED can have an impact on the stock market in the short-term. With headlines changing day-to-day, how can TSP investors make rational reallocation decisions in this type of economic and political environment?
Price Is The Only Thing That Matters
The price of the TSP funds rise and fall based on investor demand and sentiment. If demand for the S&P500 (our C fund) is strong, and investors have confidence in the economy, price moves higher. When demand wanes and investors become fearful of the economy going forward, price contracts.
As investors, we tend to focus on the "Why". Why did the price go down? Was it because of tariffs, a rise in interest rates? A statement by the FED? Did earnings miss expectations?... All of these, and many more, can be factors that drive price in the short-term.
Price takes into account every conceivable input. The price, at any given time, is what the fund is worth as there is always a buyer and a seller at the current price. This is why we say, "price is the only thing that matters". If price takes into account every possible "Why", then what we need to do as investors is focus on price.
Price Trends
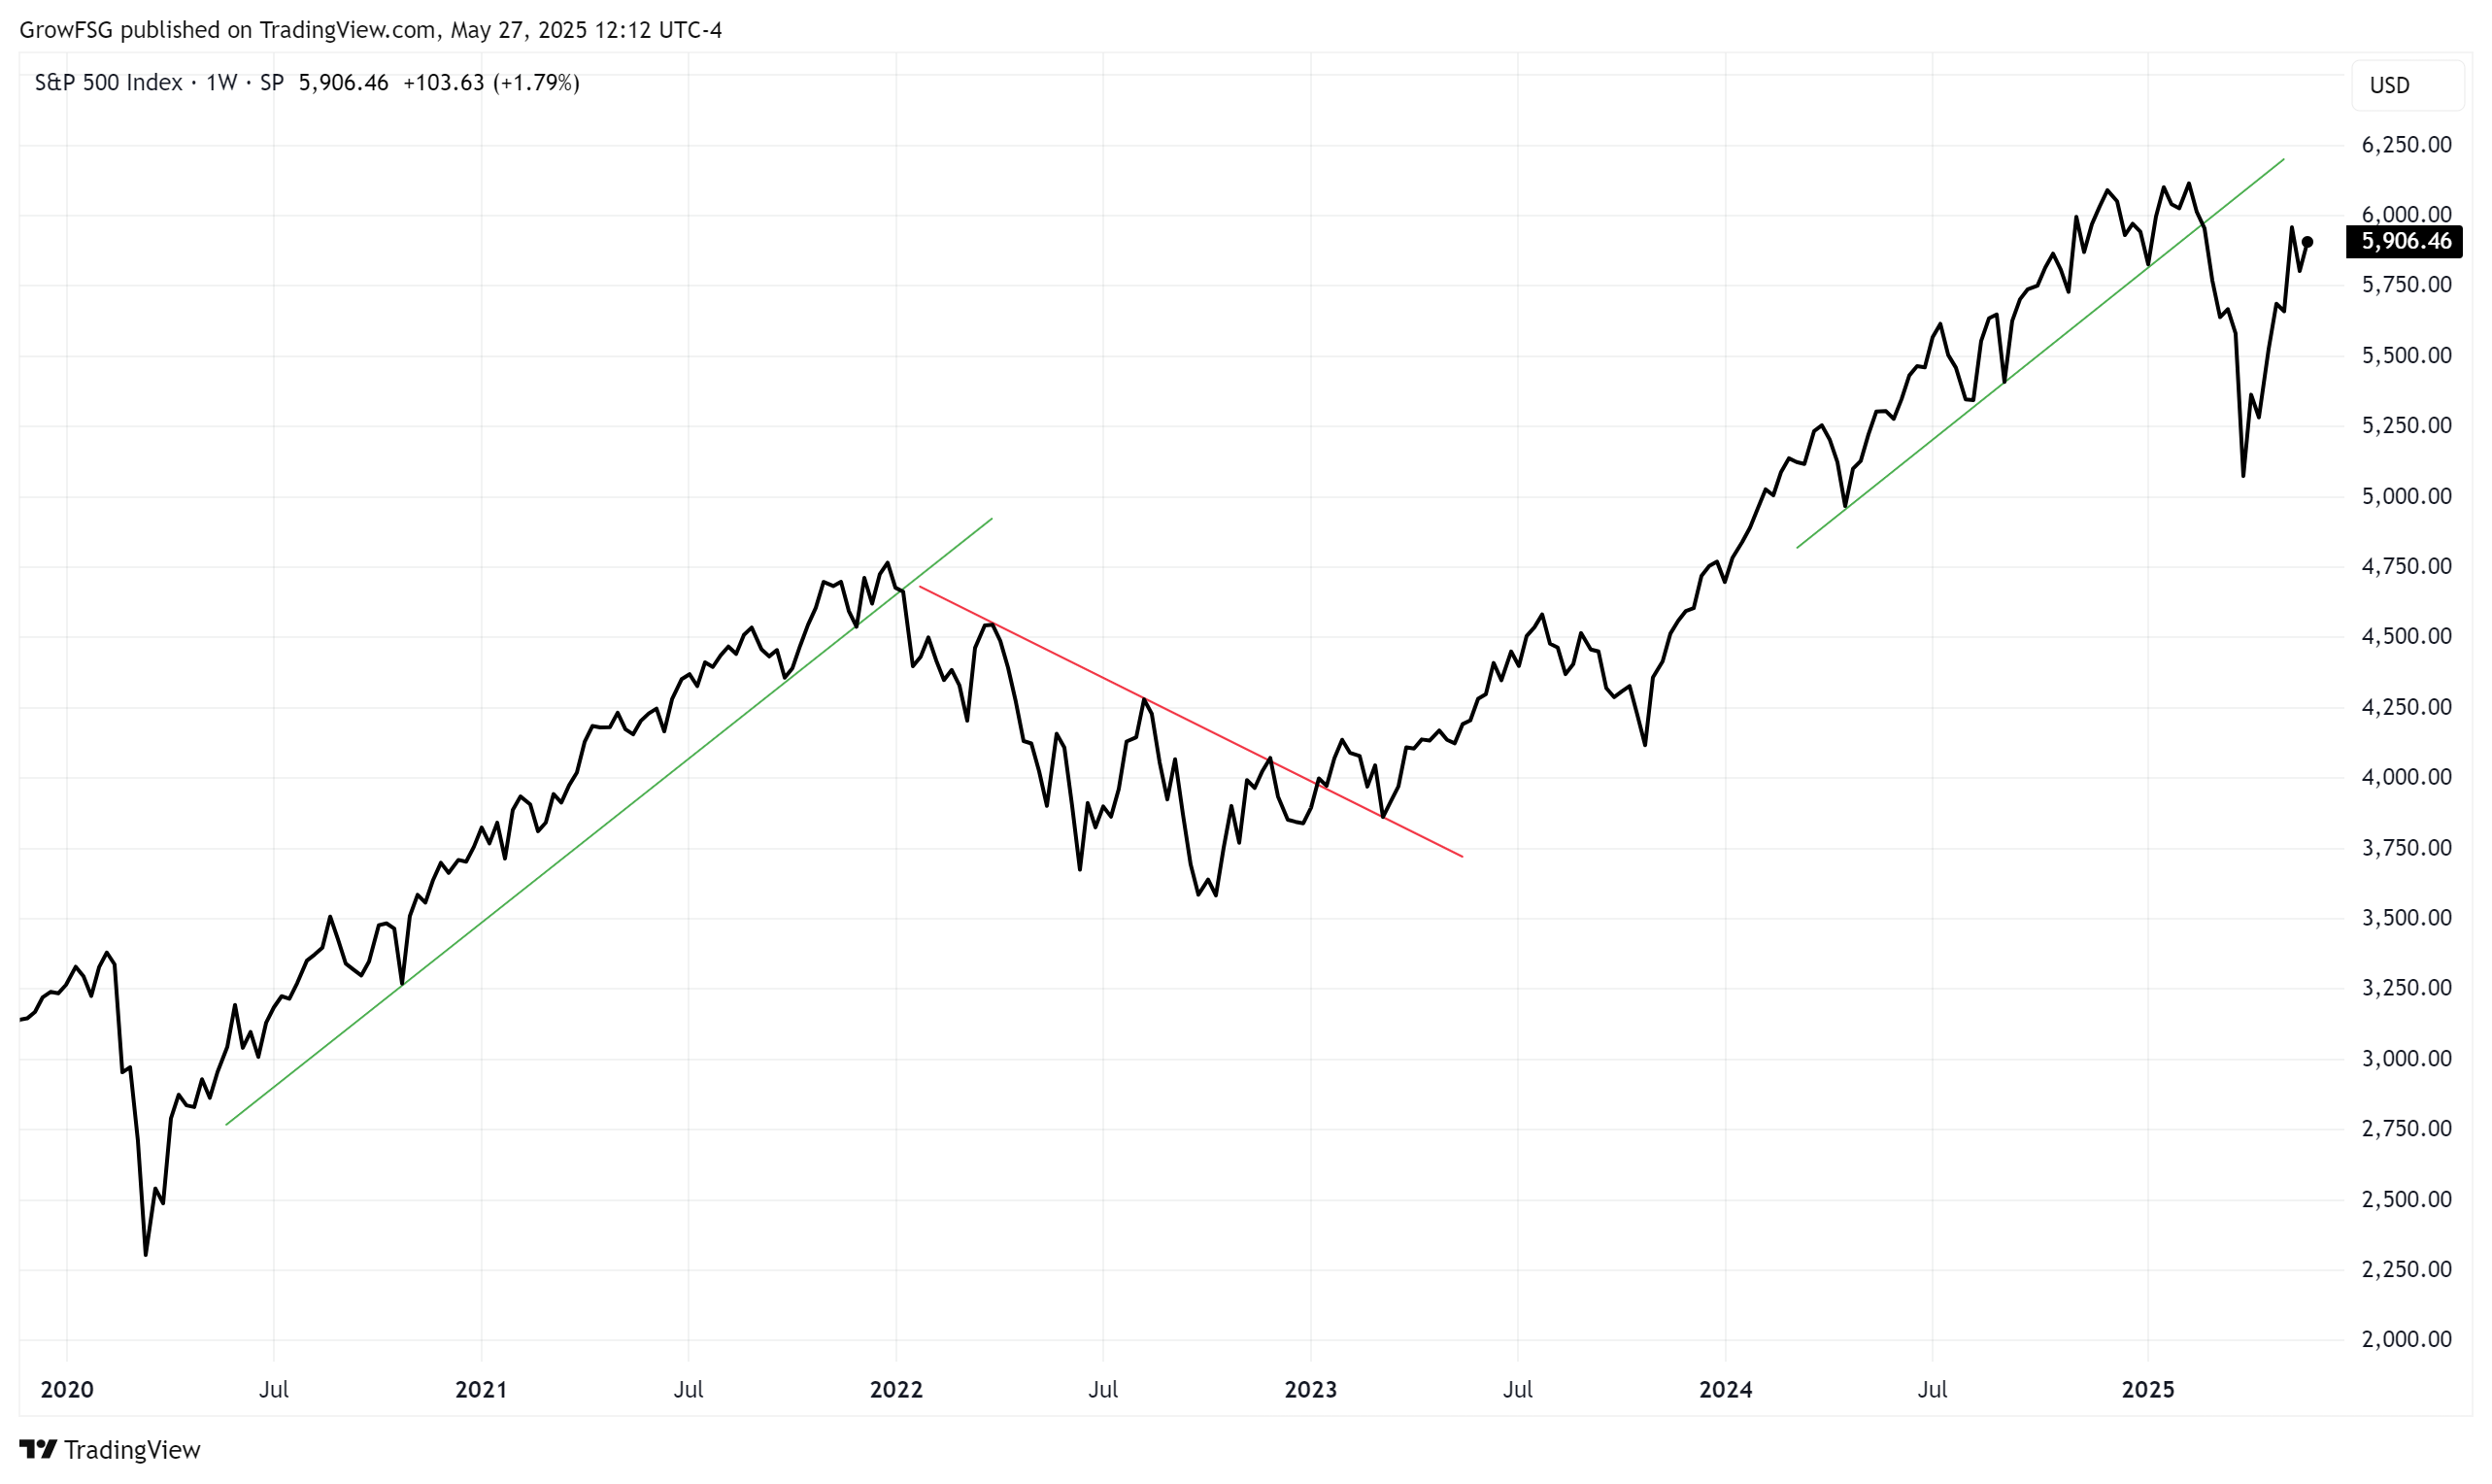
Price goes up and down in an identifiable trend. The price chart below shows the S&P500 (in black) going back to the 2020 peak. This is a weekly chart where each week's closing price is connected to form the line. Price does not go up or down in a straight line. It oscillates, but trends in one direction or the other.
We can identify the trend by drawing Trendlines. When the trend is up (a bull market), we can identify the trend by connecting the major lows. When the trend is down (a bear market), we can identify the trend by connecting the major tops. Once the trend is broken, a new trend develops in the opposite direction.
Think of all the news that has impacted the market over this 5 year period. Covid, historic money printing by the FED, interest rates rising from 0.5% to 5.0%, Bitcoin and oil rising and falling, a new Presidential Administration, wars in Russia/Ukraine and Israel/Gaza, tariffs... It was an extremely volatile period but the trends of the price chart remain orderly and reliable.
In an era of high market volatility with TSP fund prices rising and falling sharply, following a price chart is critical. The price chart tells us the direction of price, not on a day-to-day basis, but the longer-term trend. When the longer-term trend is up, TSP investors can confidently "buy the dips". When the longer-term trend is down, TSP investors can lock-in gains on rallies in anticipation of a continued downtrend.
The price chart gives us the ability to see through the day-to-day noise, media headlines, and associated emotions.
While no one can foretell the future, "the trend is your friend". The trend stays in place until it changes. You can't identify a change in trend by listening to the financial pundits, but you can see it for yourself on a price chart!
-----------------------------------------
GrowMyTSP.com does not provide personal investment advice. We are an education and analysis service, helping TSP investors grow their accounts using strategies and models that best fit their personal circumstances and risk tolerance. Get started at GrowMyTSP.com.
