
The Secret To Managing TSP In 2025
The S&P500 (our C fund) was down over 20% from its peak in mid-February to its early April bottom. We saw a strong recovery rally throughout April, giving TSP investors hope for a V shaped recovery and new all-time highs on the horizon.
That is certainly the best case scenario but seemingly inconceivable given the tariff policy and impending recession. While we can hope for a V shaped recovery, what are the alternate possibilities?
With so much volatility in the markets and ongoing geopolitical uncertainty, many analysts are raising the specter of the 2000 and 2007 stock market tops for comparison to 2025.
Setting aside tariffs, domestic and international strife, and other geopolitical concerns, what does basic Technical Analysis of price tell us about what COULD be in store for TSP investors in 2025 and beyond?
The Best Hope
The best hope for the market is something like we saw in 2022; support at the 200 Week Moving Average (WMA) line. Why is this the best hope?
The 200WMA line has provided support for every significant market correction since 2009.
If the 200WMA line fails to provide support, the market is likely headed much lower.
While there is nothing magical about the 200WMA, it’s an excellent guide for investors. As the chart shows, the area at or around the 200WMA line has provided support for every significant correction since price got back above that line following the 2009 bottom.
The past 15 years of investing experience has taught us to respect the 200WMA. Over that time period, anyone who bought the S&P500 at the 200WMA was literally buying at the bottom of the cycle. Right now, there is NO reason to believe that this time will be different.
TSP investors should expect support at the 200WMA to hold, and a new bull market to begin for stocks. That’s Plan A!
What happens if Plan A fails??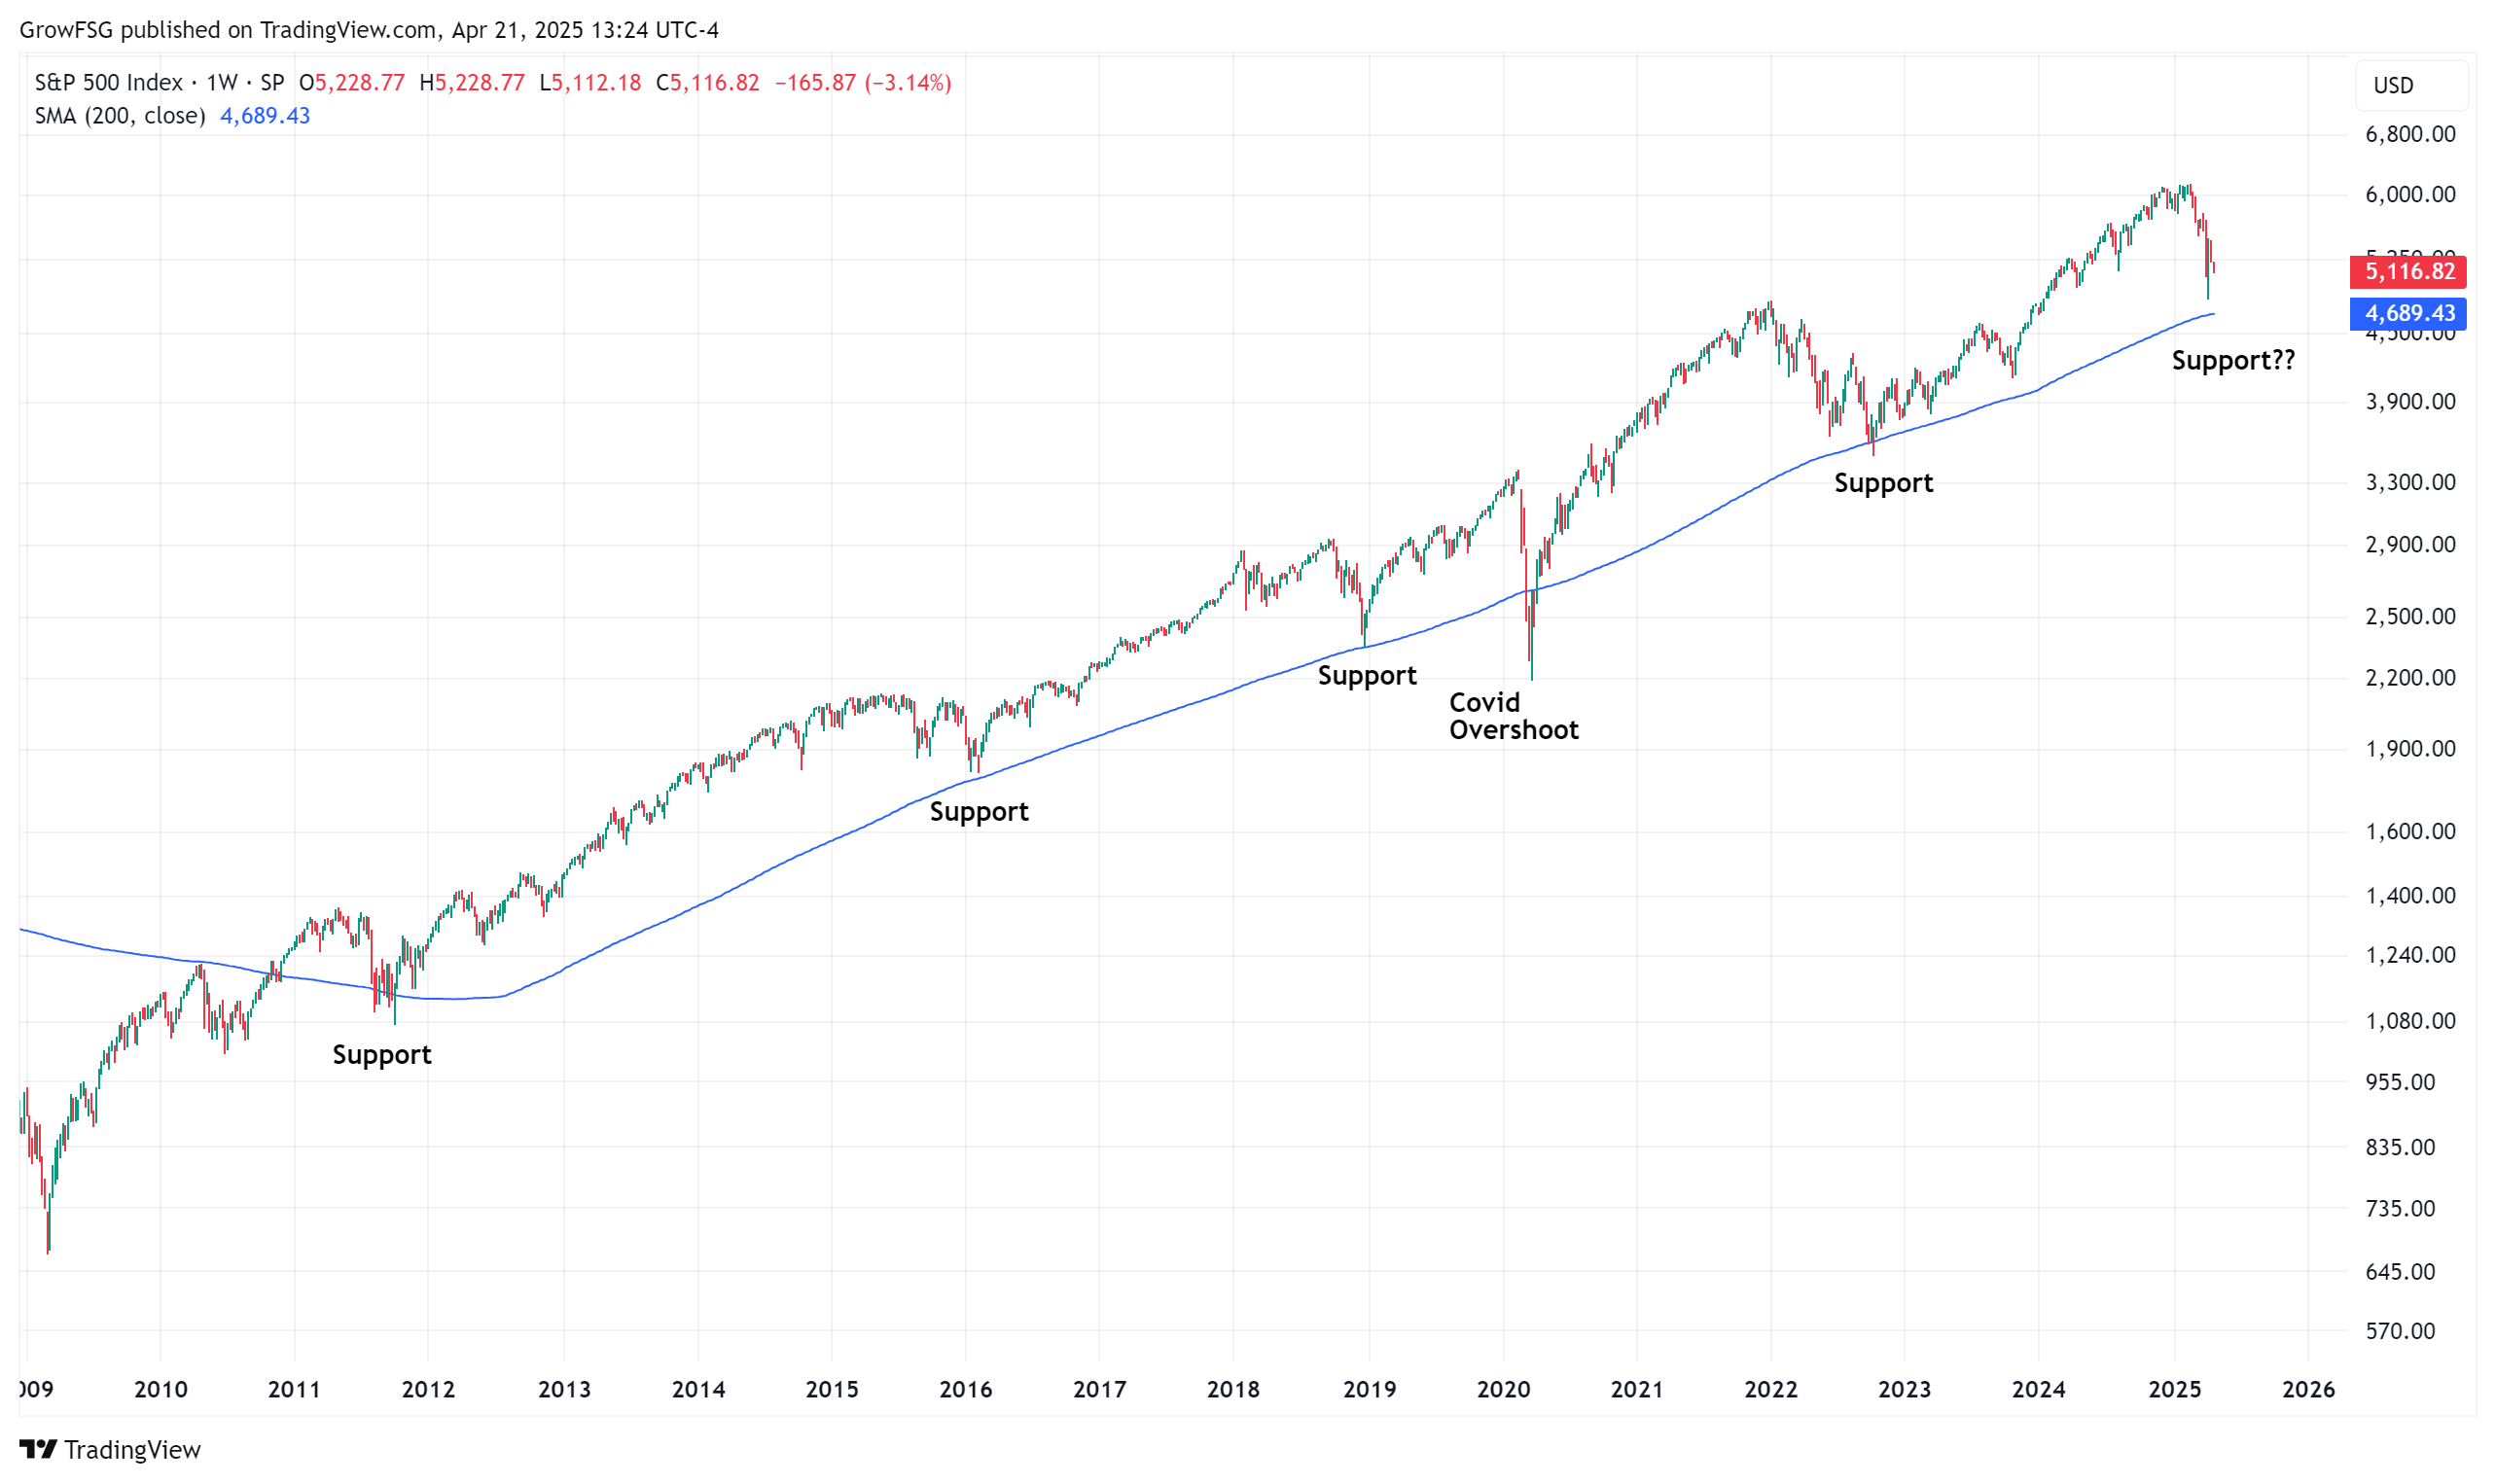
Ancient History & Recent Market Tops
The 200WMA has been an important support level between every significant bear market for over 100 years! In fact, there have only been six instances where the S&P500 spent significant time below the 200WMA since 1925.
As the chart below shows, these occurrences are extremely rare. When they do occur, you don’t want to be on the wrong side. Price can go much lower, can take years to recover, and seems to happen in pairs.
Following the 1929 market crash, stocks recovered for several years before falling below the 200WMA in 1937 and staying below it until 1943.
Stocks fell 35% from 1968 to 1970, rallied to new nominal highs, then rolled over 50% into the 1974 bottom.
Stocks fell 50% from their 2000 peak, rallied to a double top, and fell 55% into the 2009 bottom.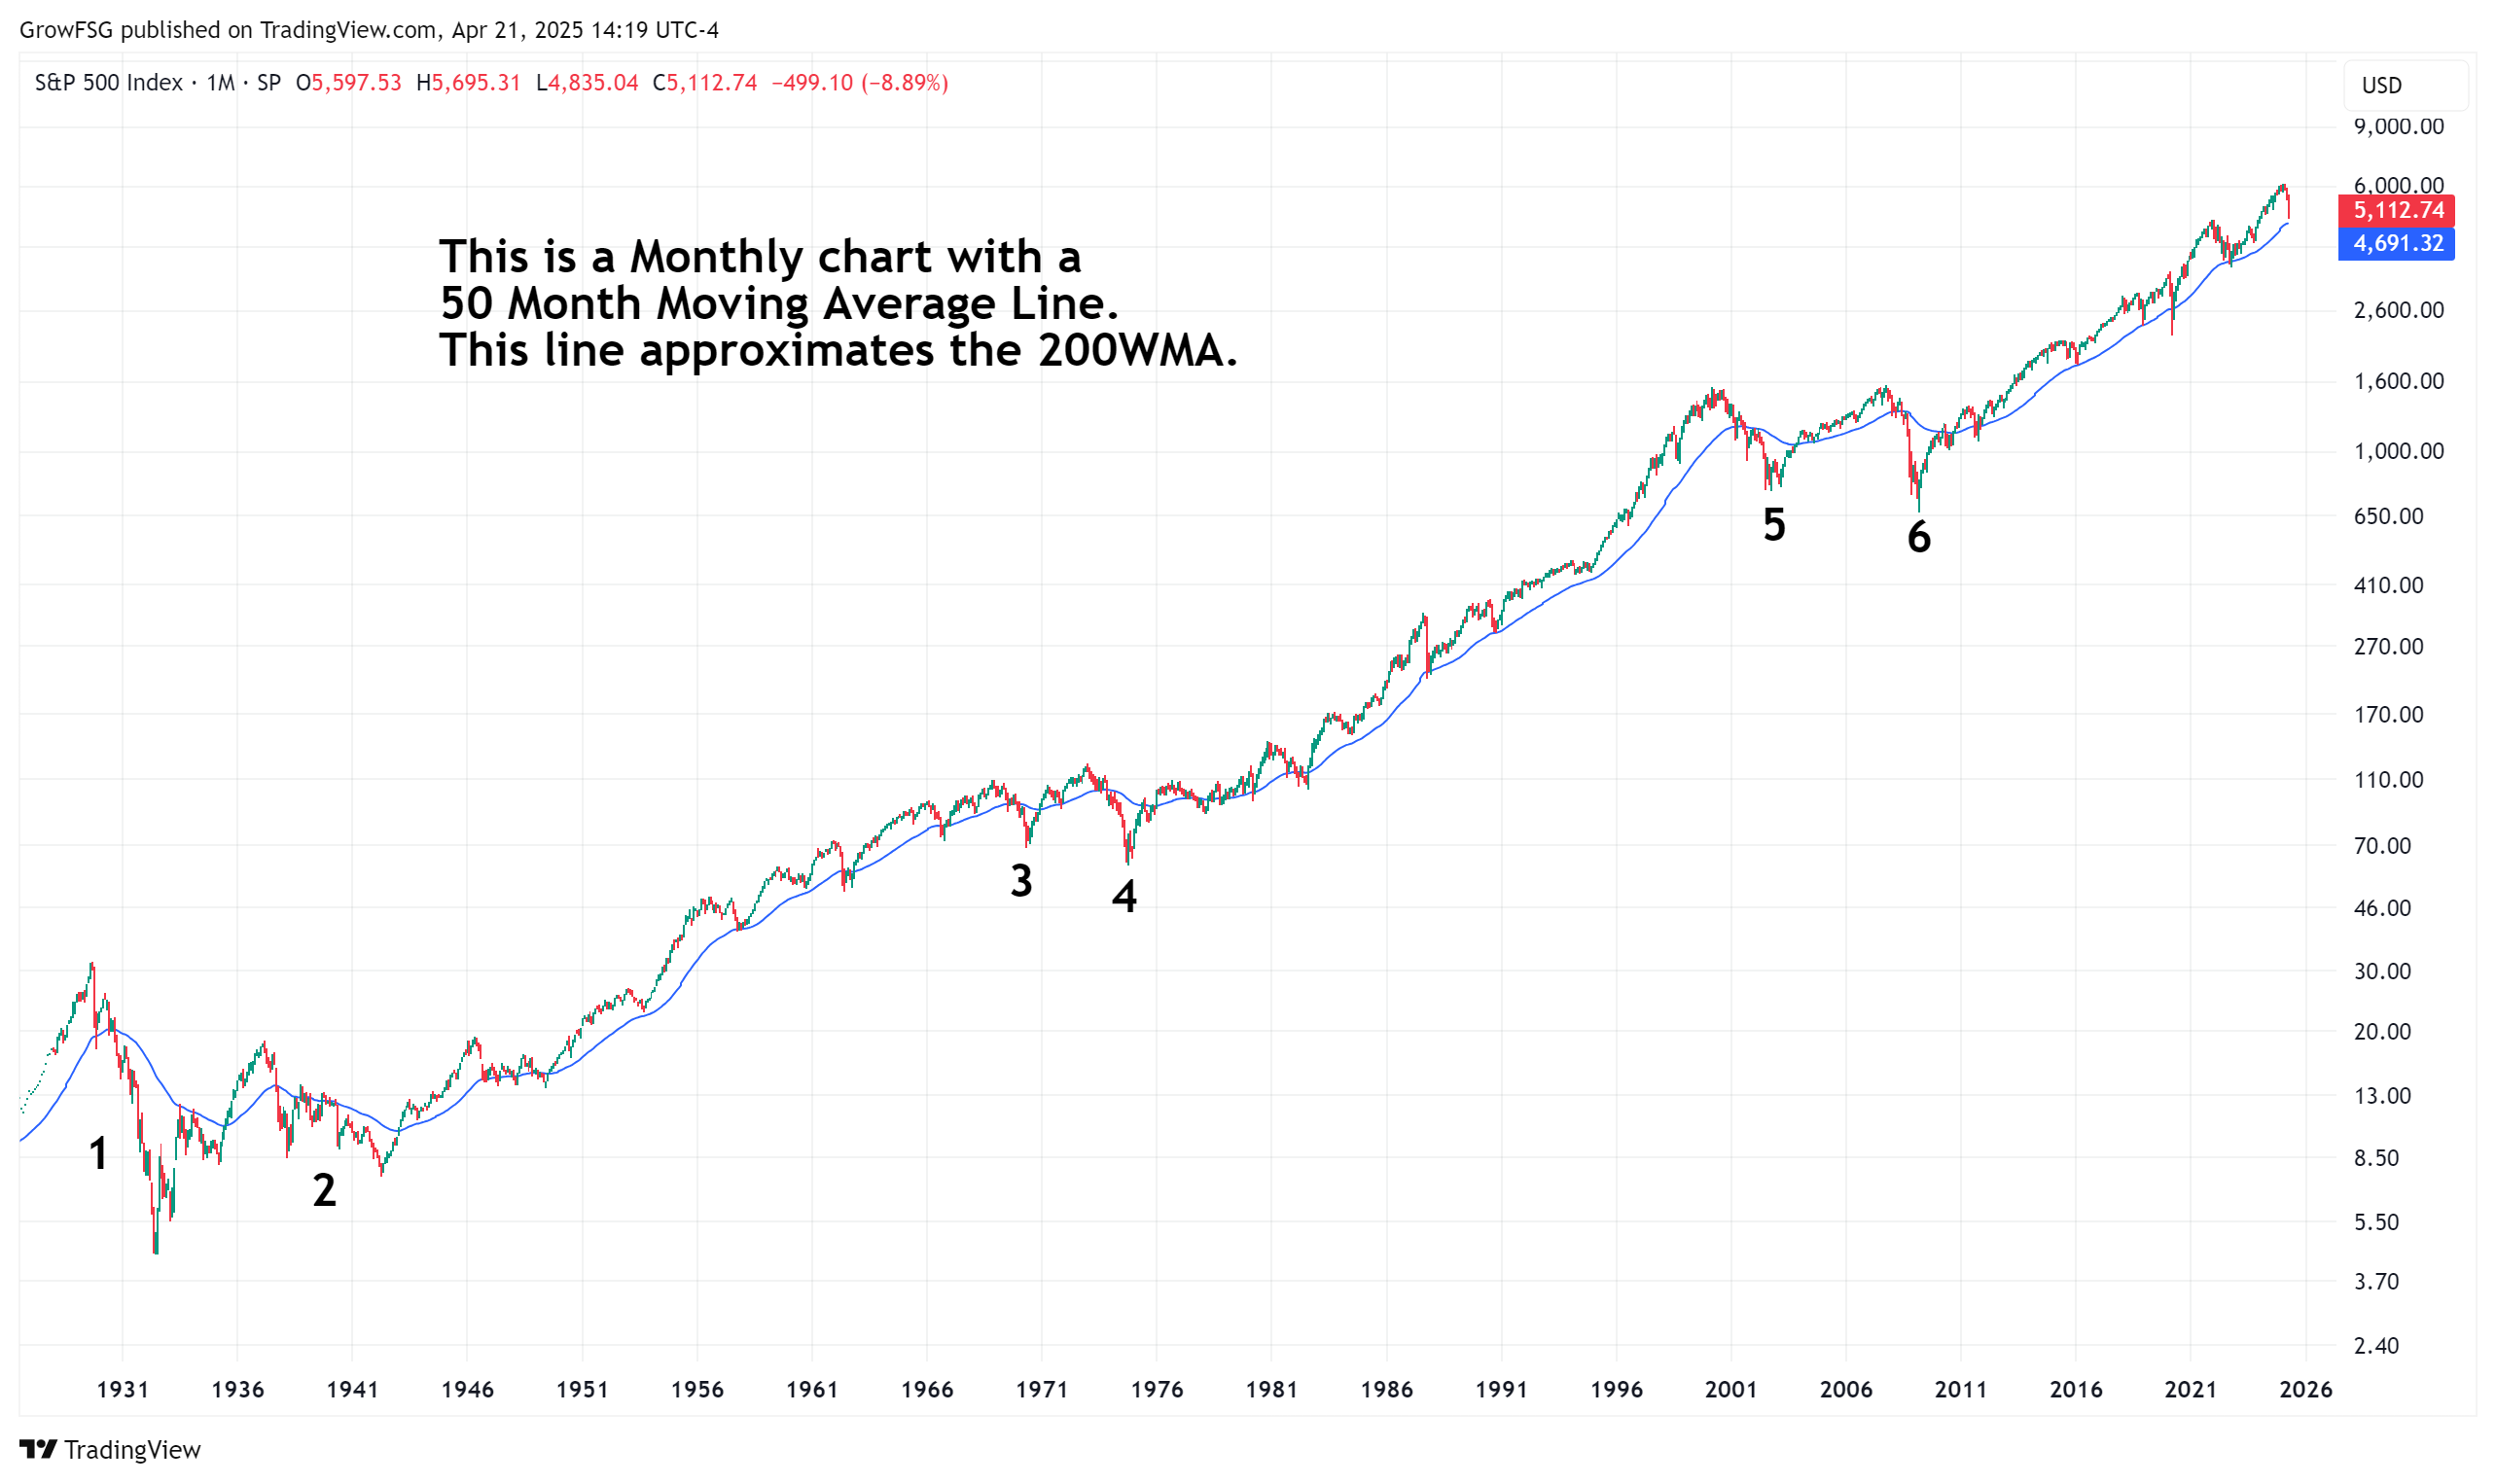
The two most recent occurrences happened following the 2000 and 2007 market peaks. What’s important for TSP investors to note is how much price fell BEFORE the breakdown through the 200WMA.
Following the 2000 peak, price fell 20% before collapsing through its 200WMA. Following the 2007 peak, price fell 15% before collapsing through its 200WMA.
It can be very difficult for TSP investors to reallocate from the stock funds to the G fund when their account balance is 15% to 20% below its high-water line. After all, this is the best time to be “buying the dip” right??
Yes, UNLESS the market proves that decision wrong.
Price doesn’t hit its 200WMA and reverse on a dime or crash right through it. Why? Because “everyone” has the same information that you’re reading right now! Everyone is looking for support at the 200WMA or a breakdown through it.
That creates lots of churn, consolidation, whipsaw, test and re-test above and below the line until price finally picks a direction. It can take some time and can be very frustrating but, the 200WMA line is ALWAYS either major support or a major failure.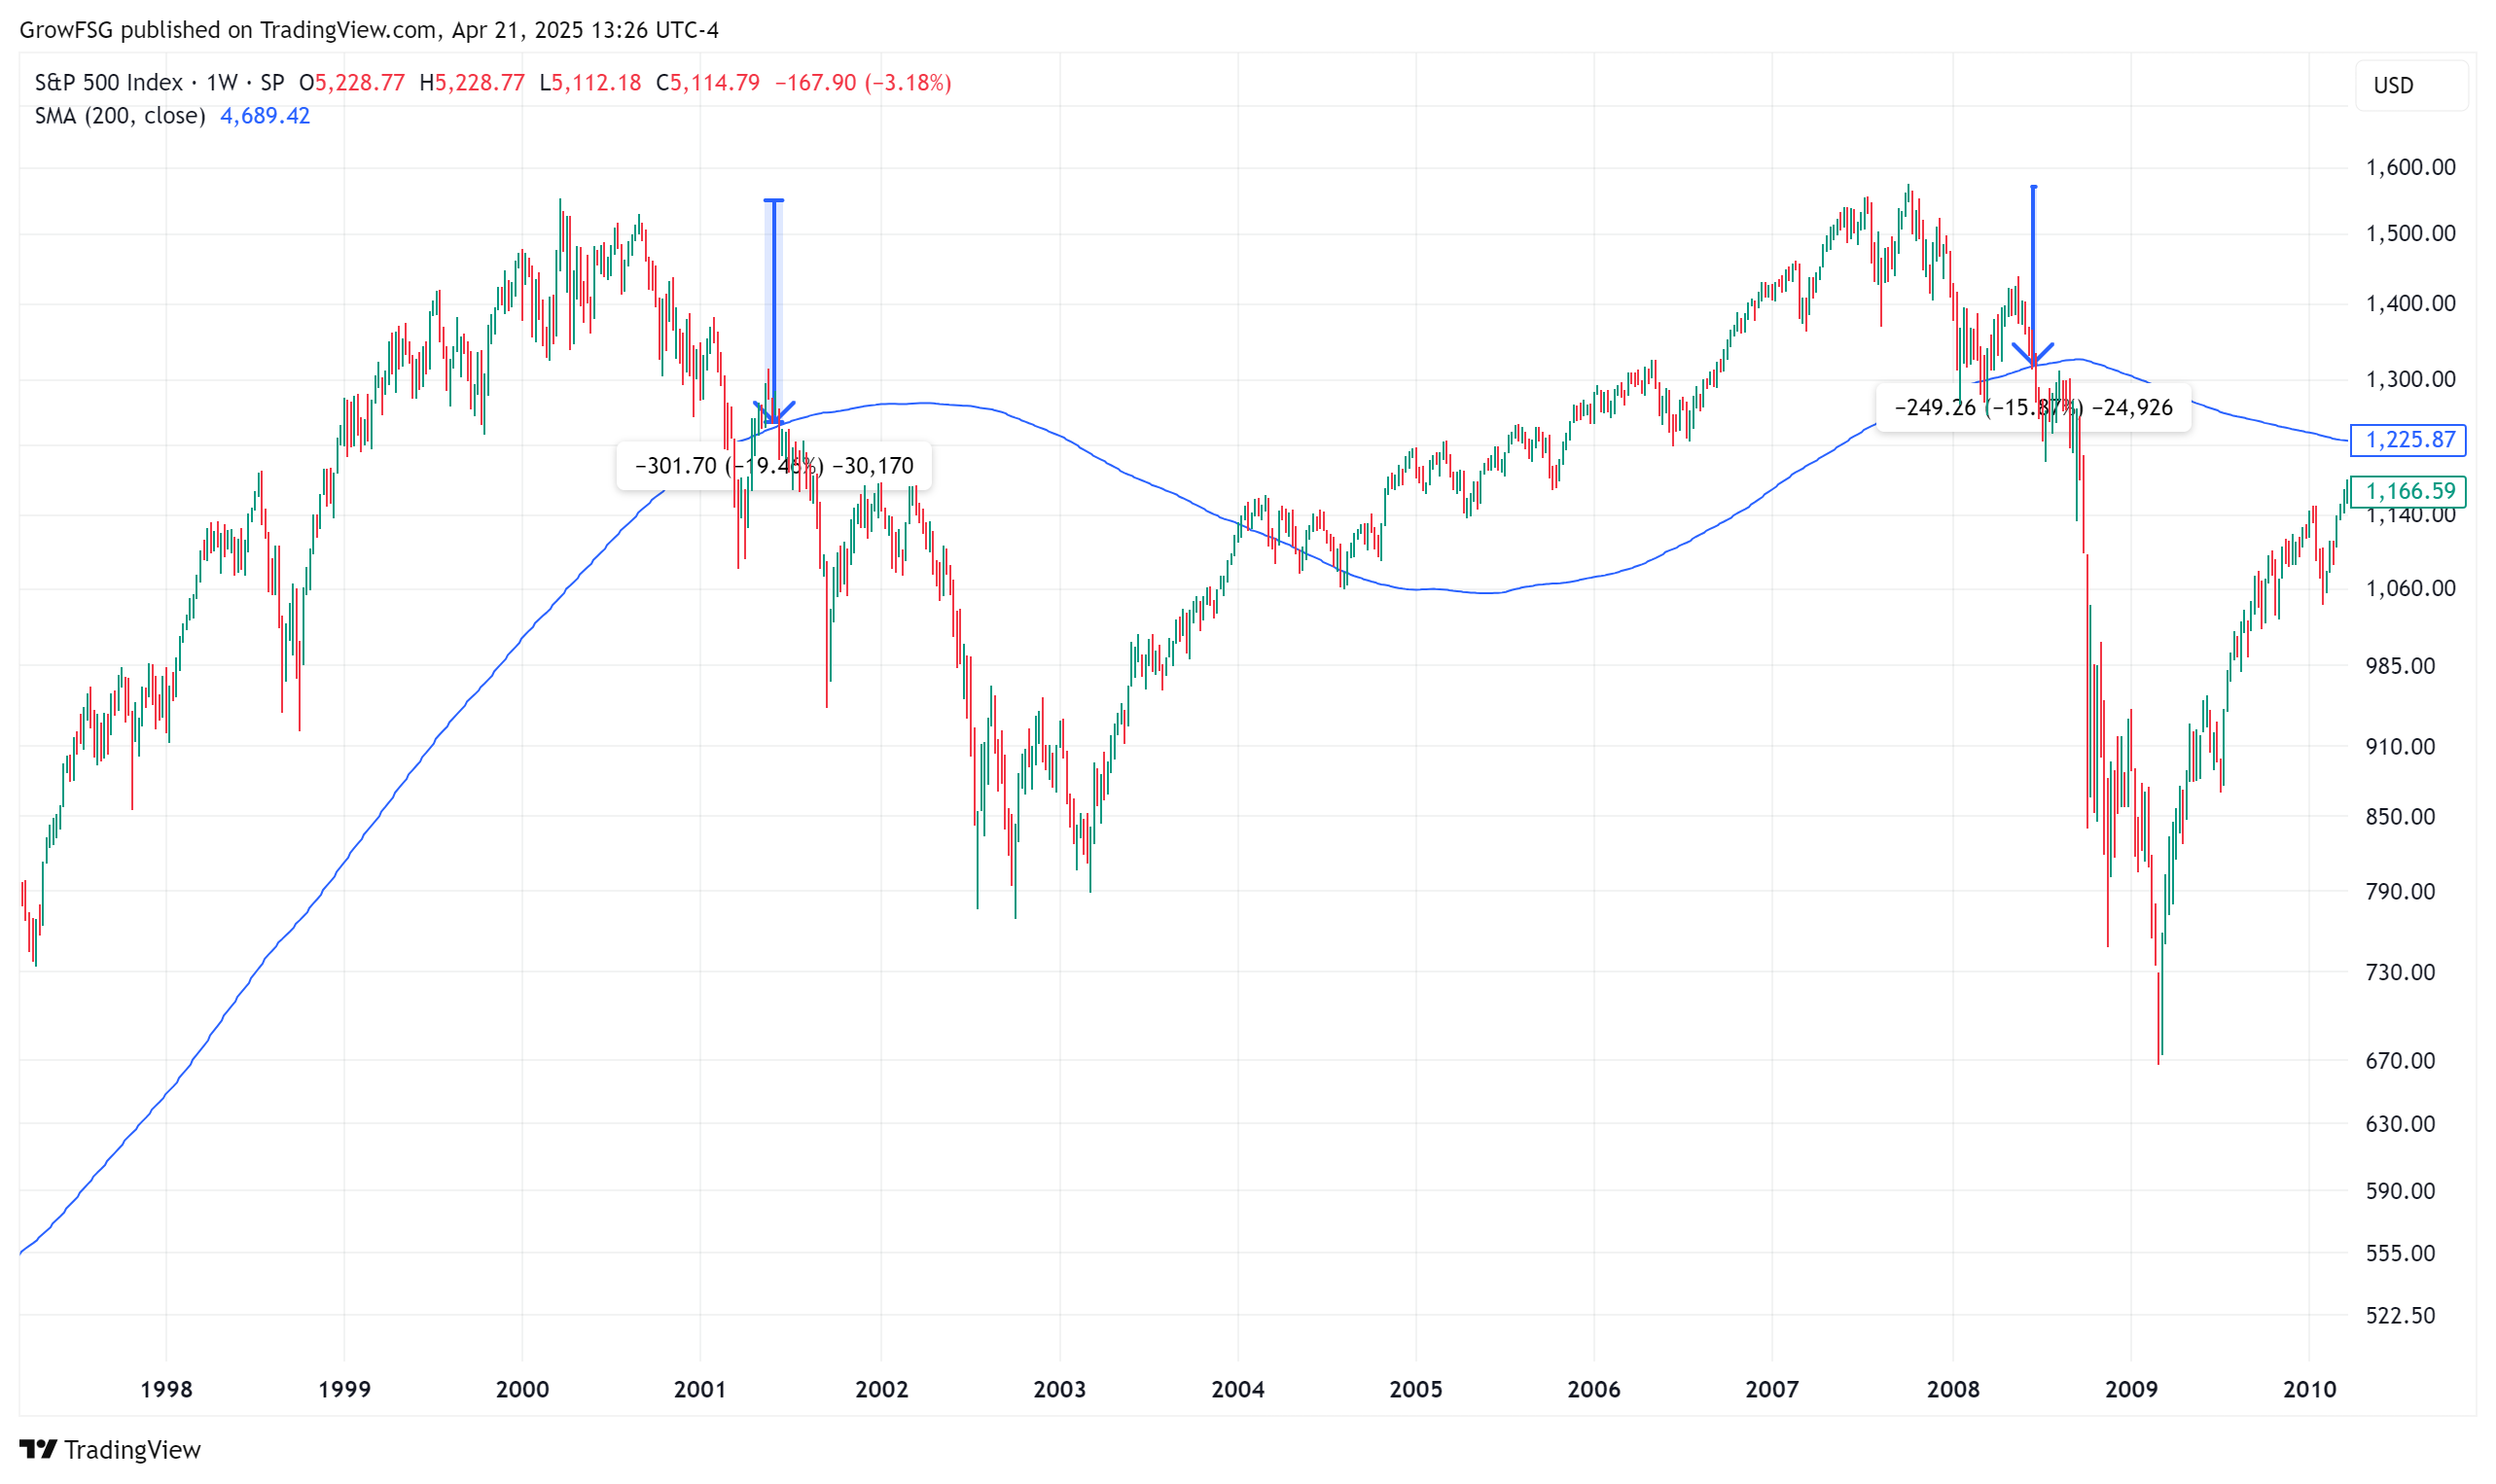
How much lower can price go IF it breaks down below its 200WMA?
From the breakdown in 2001, price fell an additional 38% before reaching its final bottom in March 2003. From the breakdown in 2008, price fell an additional 50% before the March 2009 bottom.
This is where things really get interesting for buy and hold investors. Recency bias and conventional wisdom will keep most TSP investors in the stock funds through a 20 to 30% decline. When we start to see 40-50% declines, that’s when the staunchest buy and holders tend to throw in the towel; at exactly the wrong time.
It’s hard to blame them. At that point, your $1M TSP nest egg is $500K-$600K. How much lower can it go? How many years will it take just to get back to even? How much longer will you have to work? Have your retirement plans just changed significantly?
You do NOT want to be in the stock funds when price is below its 200WMA...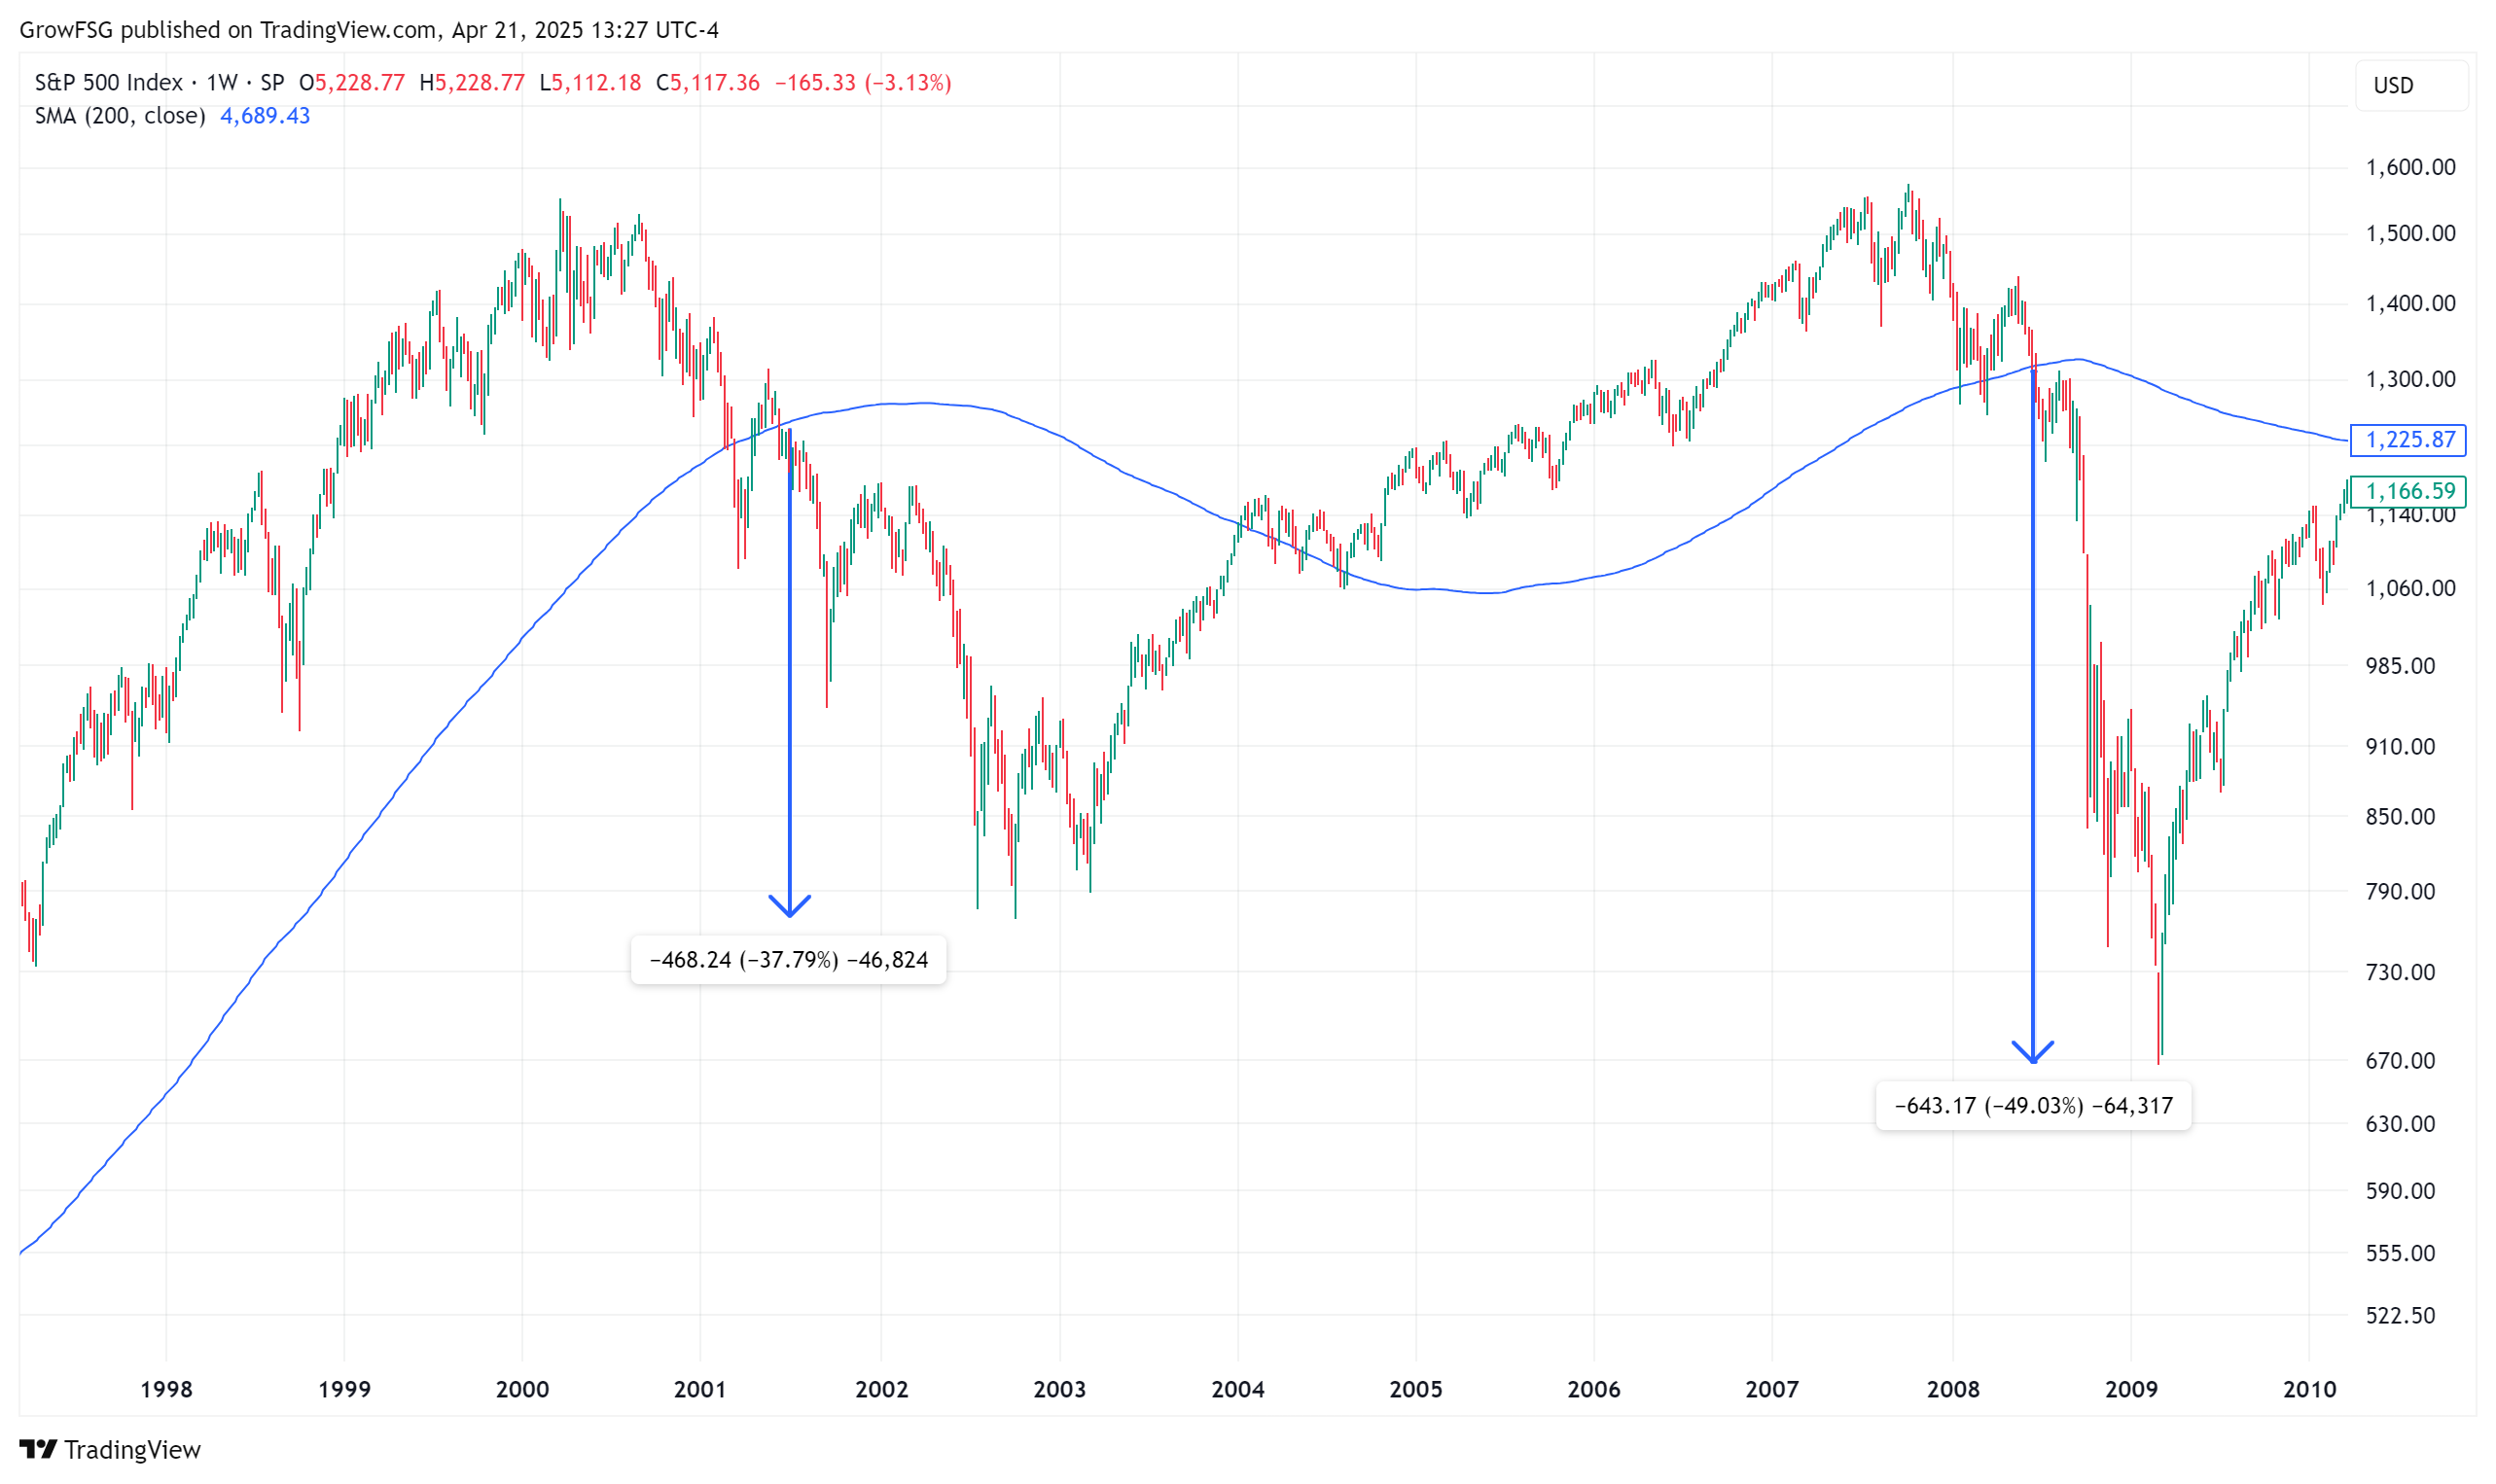
Possibilities For 2025
The V shaped recovery to new highs is the hope. If price rolls over before making new highs, we need to be prepared for the alternate scenarios.
History tells us that we should expect price to find support at or around the 200WMA. That’s plan A and would be an excellent buying opportunity IF support holds.
What if support fails? How low can we expect price to go?
The average drop when support failed in 2001 and 2008 was an additional 44% decline. That price on the S&P500 is 2650 and is a perfect Fibonacci 38% correction of the entire bull market from the 2009 low to the 2025 peak.
Is this really a possibility? Absolutely. Is this a prediction? Absolutely NOT. Remember, plan A is for support to hold. If support fails, this is one reasonable possibility of what COULD happen.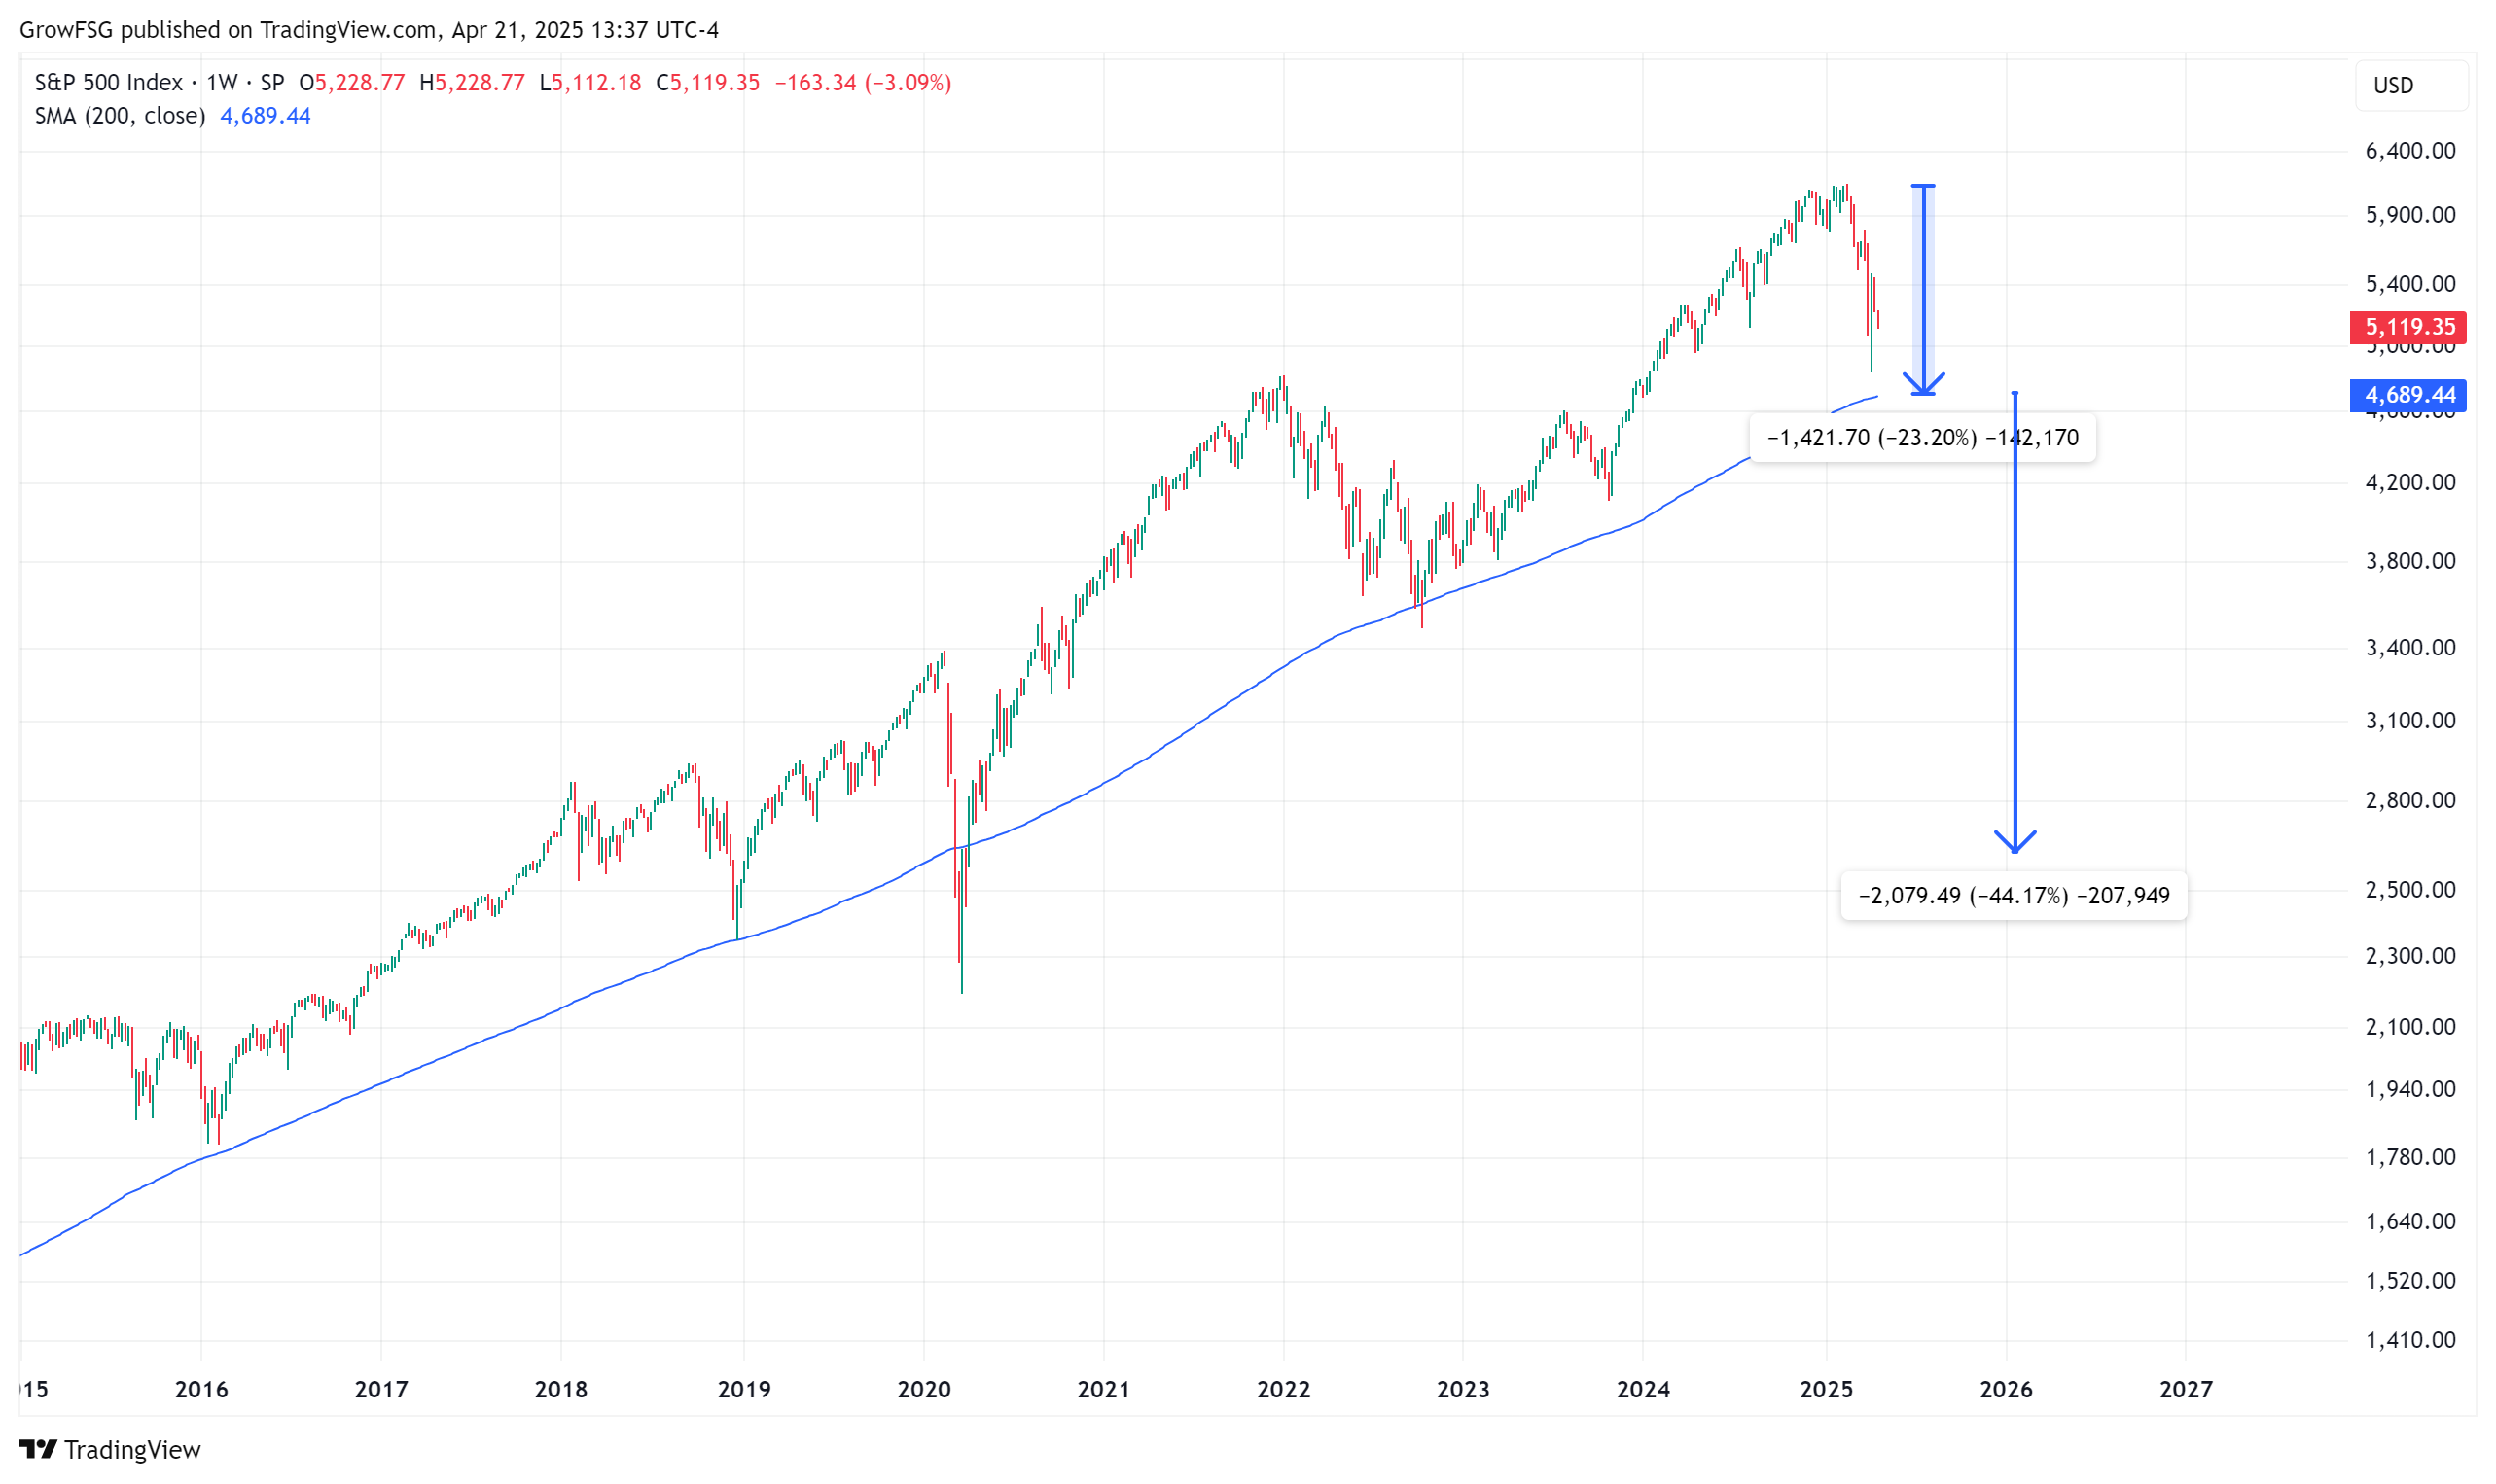
Bottom Line
2025 has been a tough year for TSP investors, especially coming off two back-to-back years of 20%+ gains. Investors are getting concerned, and rightly so.
What happens if the market keeps falling? How low can it go? How do I know when to make the decision to cut my losses?
We’ve answered all three of these questions in this post. Now it’s up to you to watch price, see how it acts at its 200WMA, and make decisions based on your personal circumstances and risk tolerance.
You might not get it right the first time. Price may oscillate above and below its 200WMA for weeks or months. At some point, the next primary trend direction will emerge. You want to be on the right side of that trend.
-----------------------------------------
GrowMyTSP.com does not provide personal investment advice. We are an education and analysis service, helping TSP investors grow their accounts using strategies and models that best fit their personal circumstances and risk tolerance. Get started at GrowMyTSP.com.
