
The Return Of The I Fund
For TSP investors old enough to remember, the I fund was all the rage in the early 2000s. In fact, the I fund more than doubled the rate of return of the C fund from 2003 to 2007! Is the I fund making a comeback in 2025? More importantly, what does the long-term chart of the C fund vs the I fund tell us about a Buy & Hold TSP investment strategy?
* For this article, we are using the "Old I Fund" which tracked the Europe, Asia, Far-East Index (EFA) *
The Heyday Of The I Fund
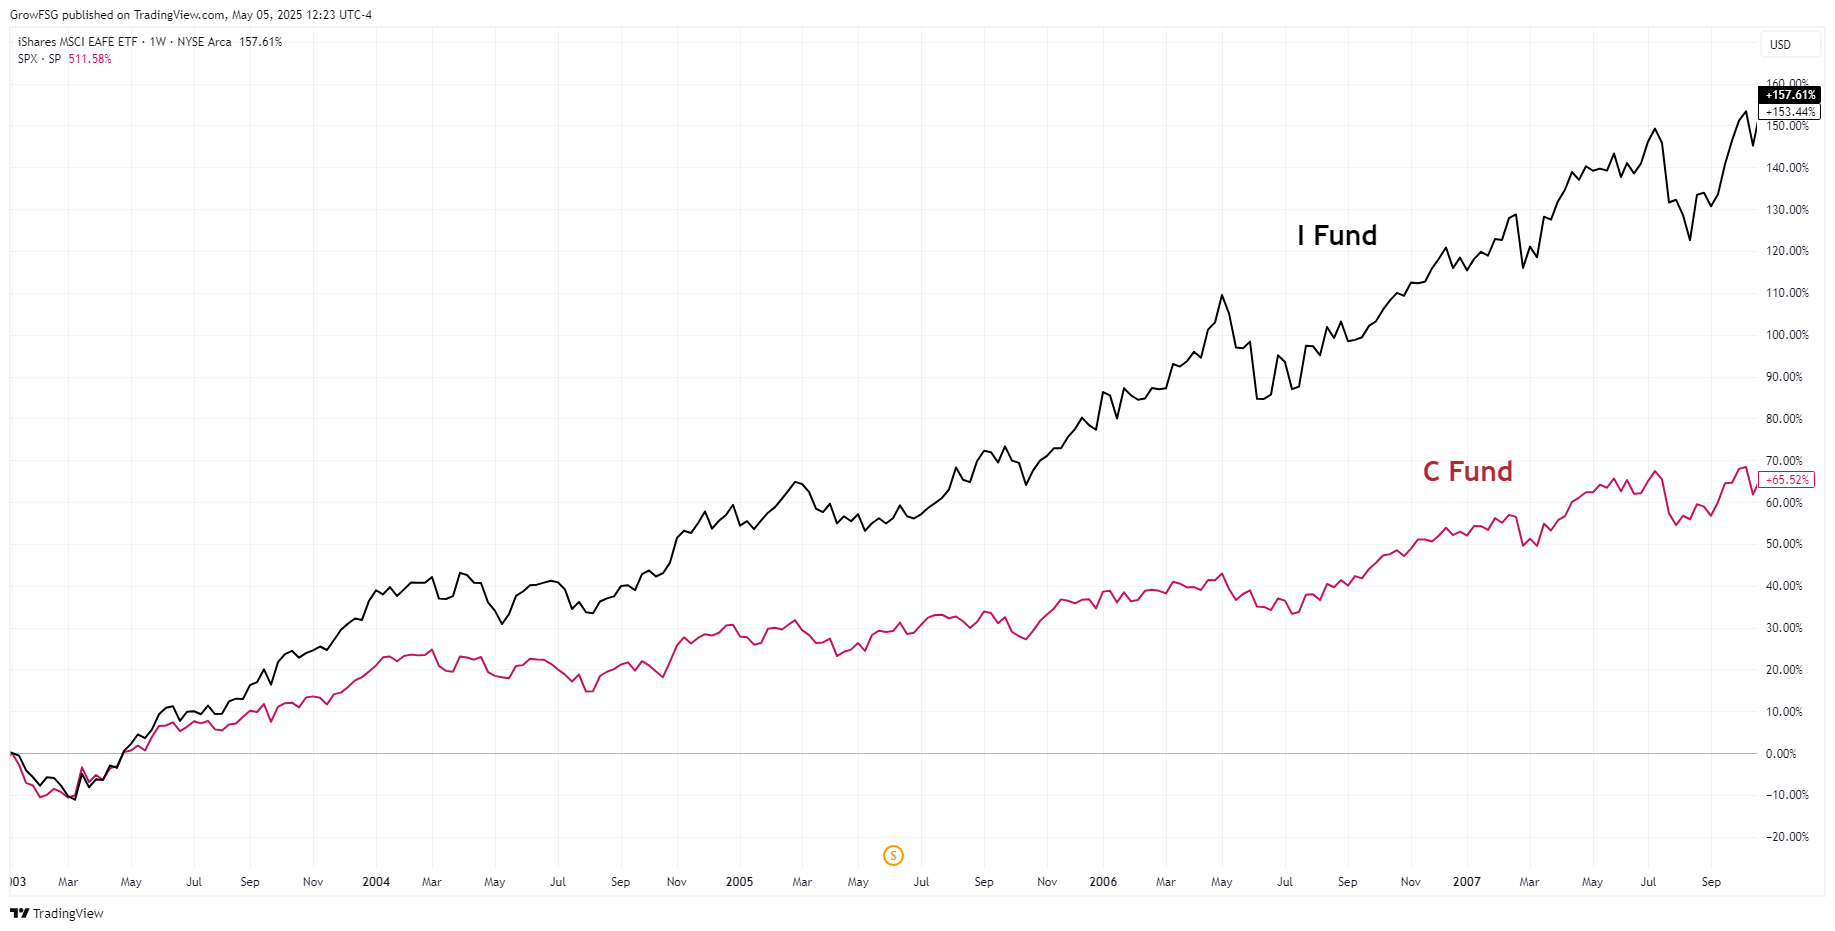
As the chart below shows, the I fund more than doubled the rate of return of the C fund from 2003 to late 2007. Many TSP investors were allocated 100% I fund to take full advantage of its outperformance. At the time, the most common and successful Buy & Hold investment strategy was 100% I fund. As hard as it is to believe today, after years of outperformance, the bias of investors became very skewed to the I fund.
Recency bias is a human condition that always exists. We extrapolate the recent past to create expectations for the future. There can be great value in extrapolating into the future BUT we must remember that all trends eventually come to an end. The market is cyclical and capital eventually flows to undervalued assets.
The Transition
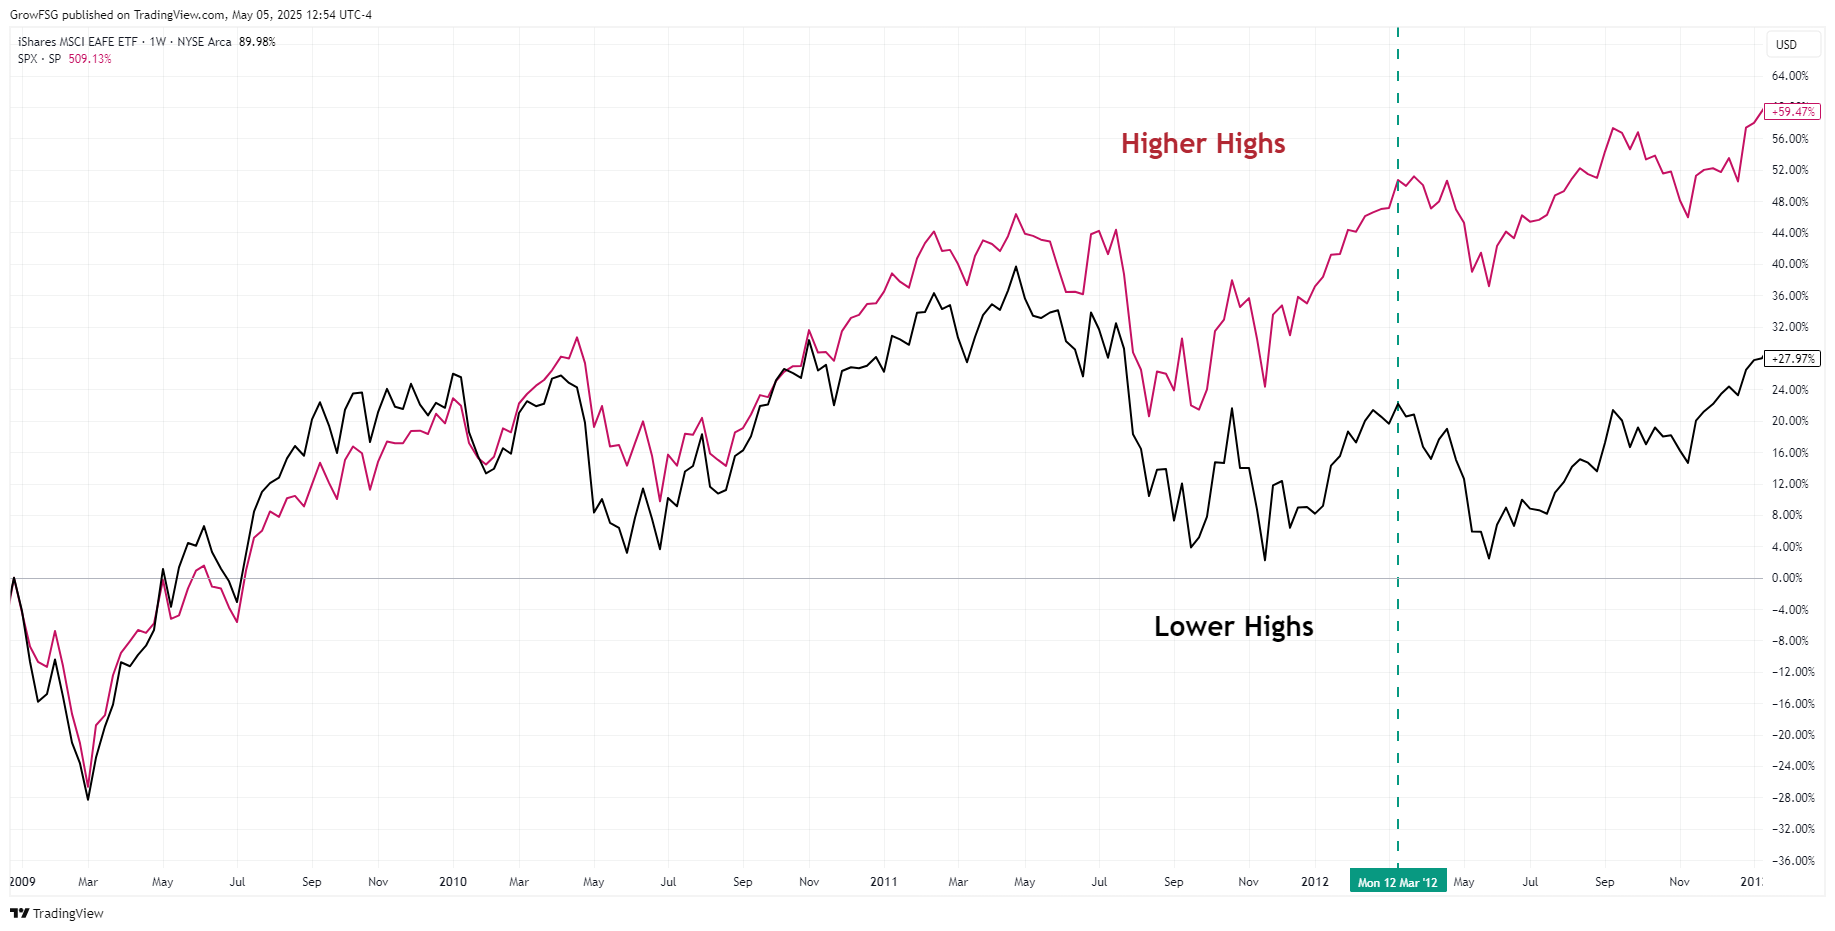
Following the stock market bottom in 2009, the C and I funds performed similarly until 2011. By early 2012, the C fund had made new highs while the I fund made a lower high. This confirmed a new long-term trend of outperformance for the C fund. From this split in 2012, the dominance of the C fund would remain in place for the next 12 years.
Present Day
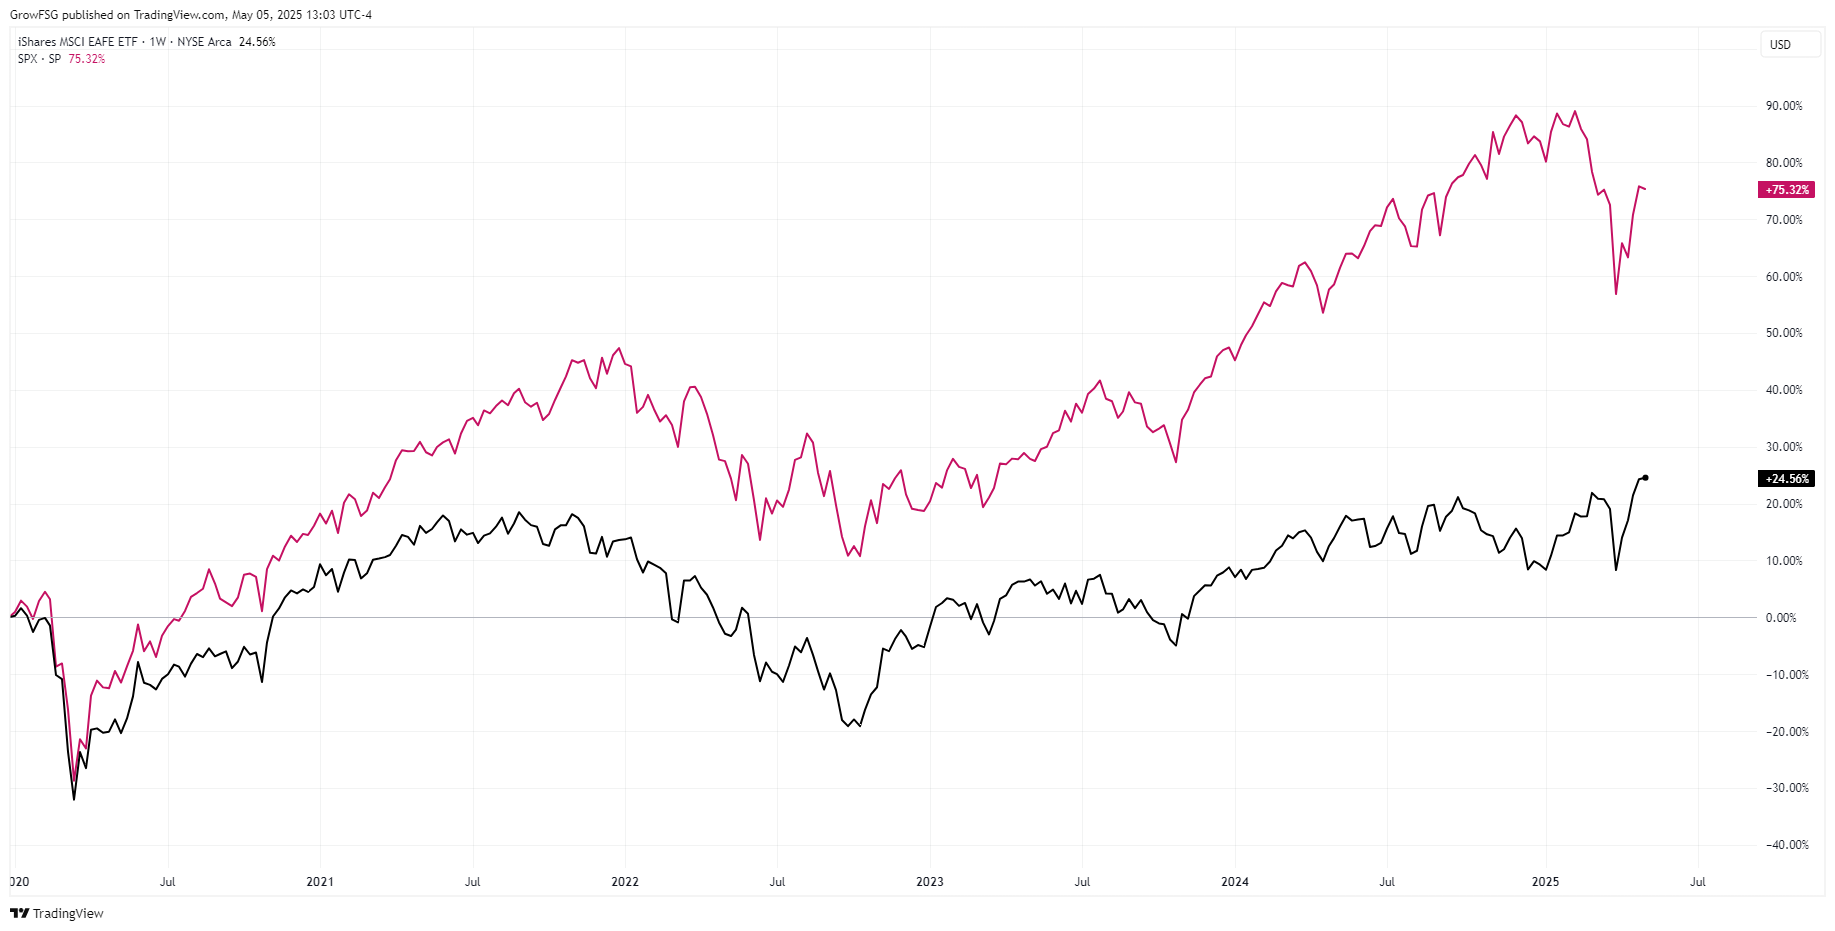
Following the 2020 Covid market bottom, the relative dominance of the C fund continued. By early 2025, the performance of the C fund was 4x that of the I fund relative to the 2020 bottom.
This is where the story begins to change. While both the C and I funds fell in early 2025, the C fund fell considerably more and recovered only half of its losses by early May. In contrast, the I fund did not make a lower low and its recovery has taken price to new all-time highs. This chart is showing us a POTENTIAL long-term change in outperformance of the I fund relative to the C fund.
Can the C fund recover from here and reclaim its dominance over the I fund? Absolutely. The point is to see the POTENTIAL change happening. What if the C fund rolls over and takes out it's recent lows while the I fund continues to make new highs? At that point, the baton will have been passed and I fund dominance should be expected for the foreseeable future.
The Impact on Buy & Hold Investing
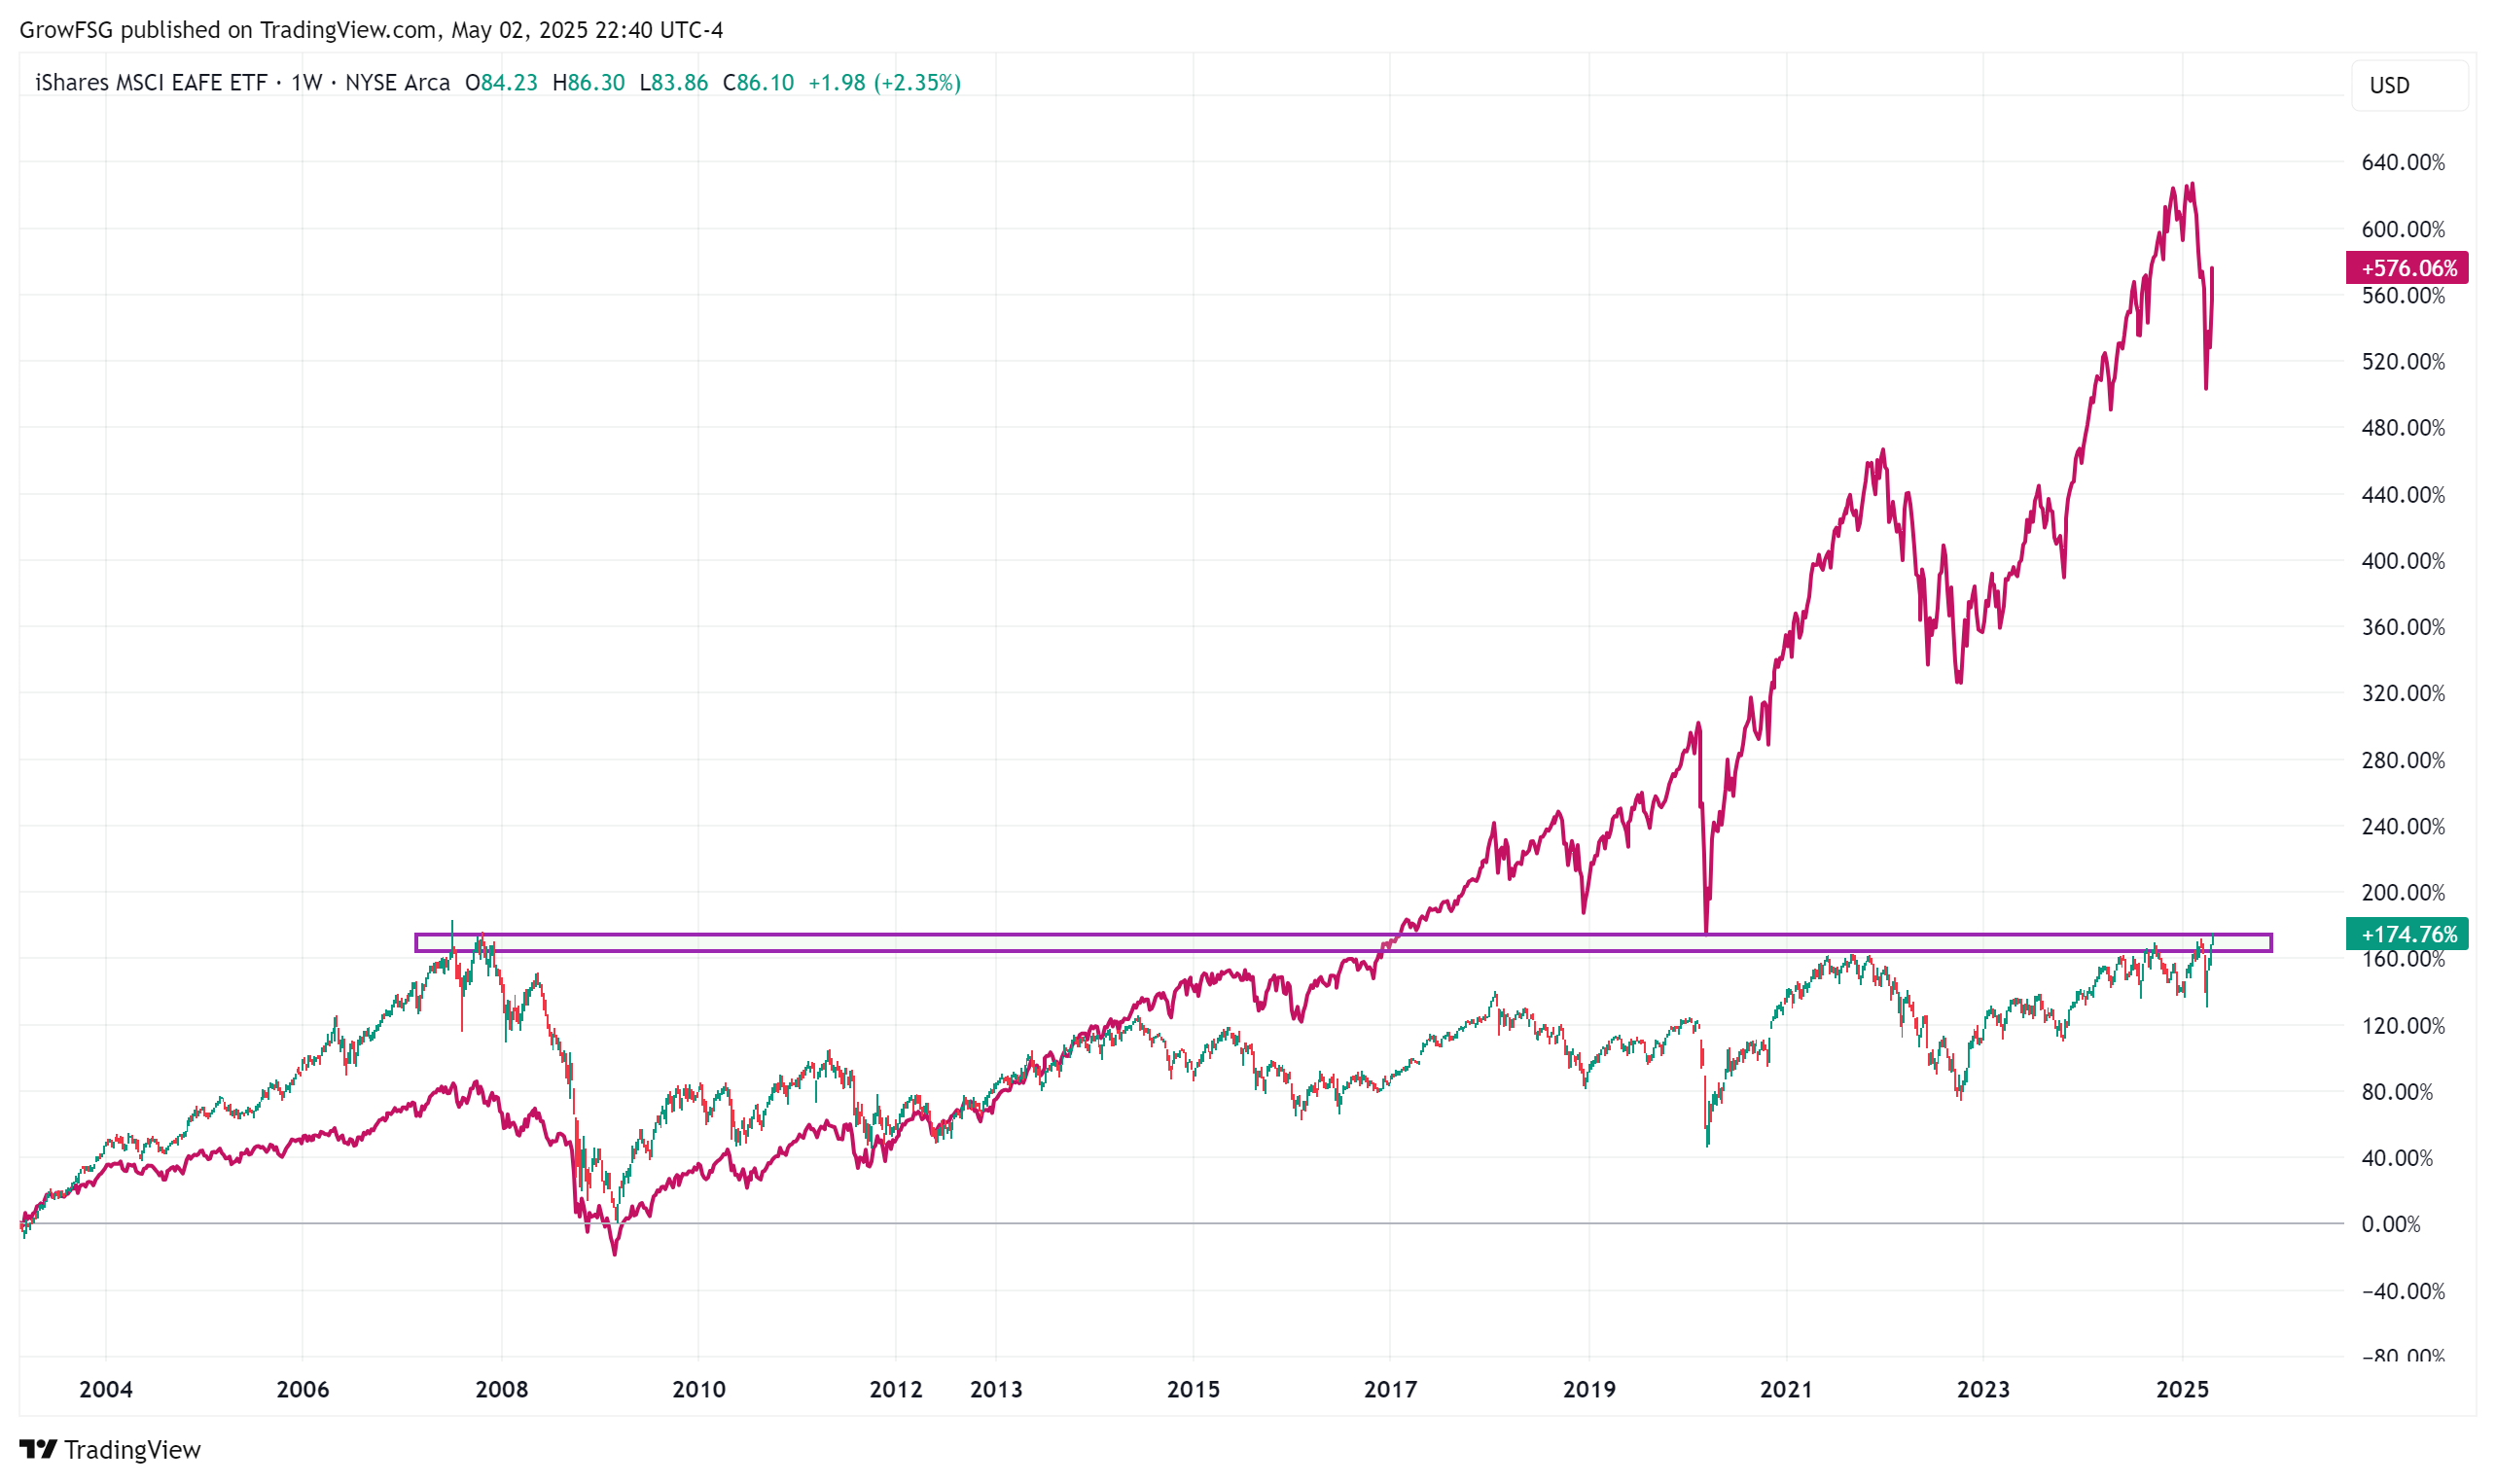
The chart below SHOULD be a big wake-up call for buy & hold investors. Recency bias tells us that 50% C fund / 50% S fund is the best long-term allocation for TSP investors. Many TSP investors believe this to their core. Recency bias can be very hard to overcome, especially when the past 12 years of performance has proven you right. Why would you consider making a change?
We need to remember that TSP investors in 2007 had the same bias. Those that held to that bias saw their accounts fall over 60% during the Great Financial Crisis and finally get back to even in May 2025. It took 28 years to get back to even!
Can this happen in the C fund? Could we look back 10 or 20 years from now and see, not only I fund out performance, but no gains in the C fund over that time period? It's absolutely possible.
Bottom Line
Is the I fund making a comeback in 2025? The jury is still out but the charts are telling us to be open to the possibility.
More importantly, this article should give Buy & Hold investors a reason to pause, consider their biases, and be open to possibilities beyond a 50% C fund / 50% S fund allocation.
A Buy & Hold strategy can be very effective IF you select the funds that are trending higher over time.
-----------------------------------------
GrowMyTSP.com does not provide personal investment advice. We are an education and analysis service, helping TSP investors grow their accounts using strategies and models that best fit their personal circumstances and risk tolerance. Get started at GrowMyTSP.com.
