
TSP Weekly Newsletter
TSP Weekly Newsletter
April 28, 2024
It was a solid recovery week for stocks. Friday's big up day was lead by a fresh breakout for Nvidia and a 10% move higher for Google! What's really strange was how the market responded to Friday's hot inflation report. For the week the C fund finished up 2.67%, S fund up 2.91%, I fund up 2.42%, and the F fund down 0.05%. After three solid weekly declines, this week's rally was a welcome relief. What does this week's price action tell us about the likelihood that we've seen the bottom of this pull back?
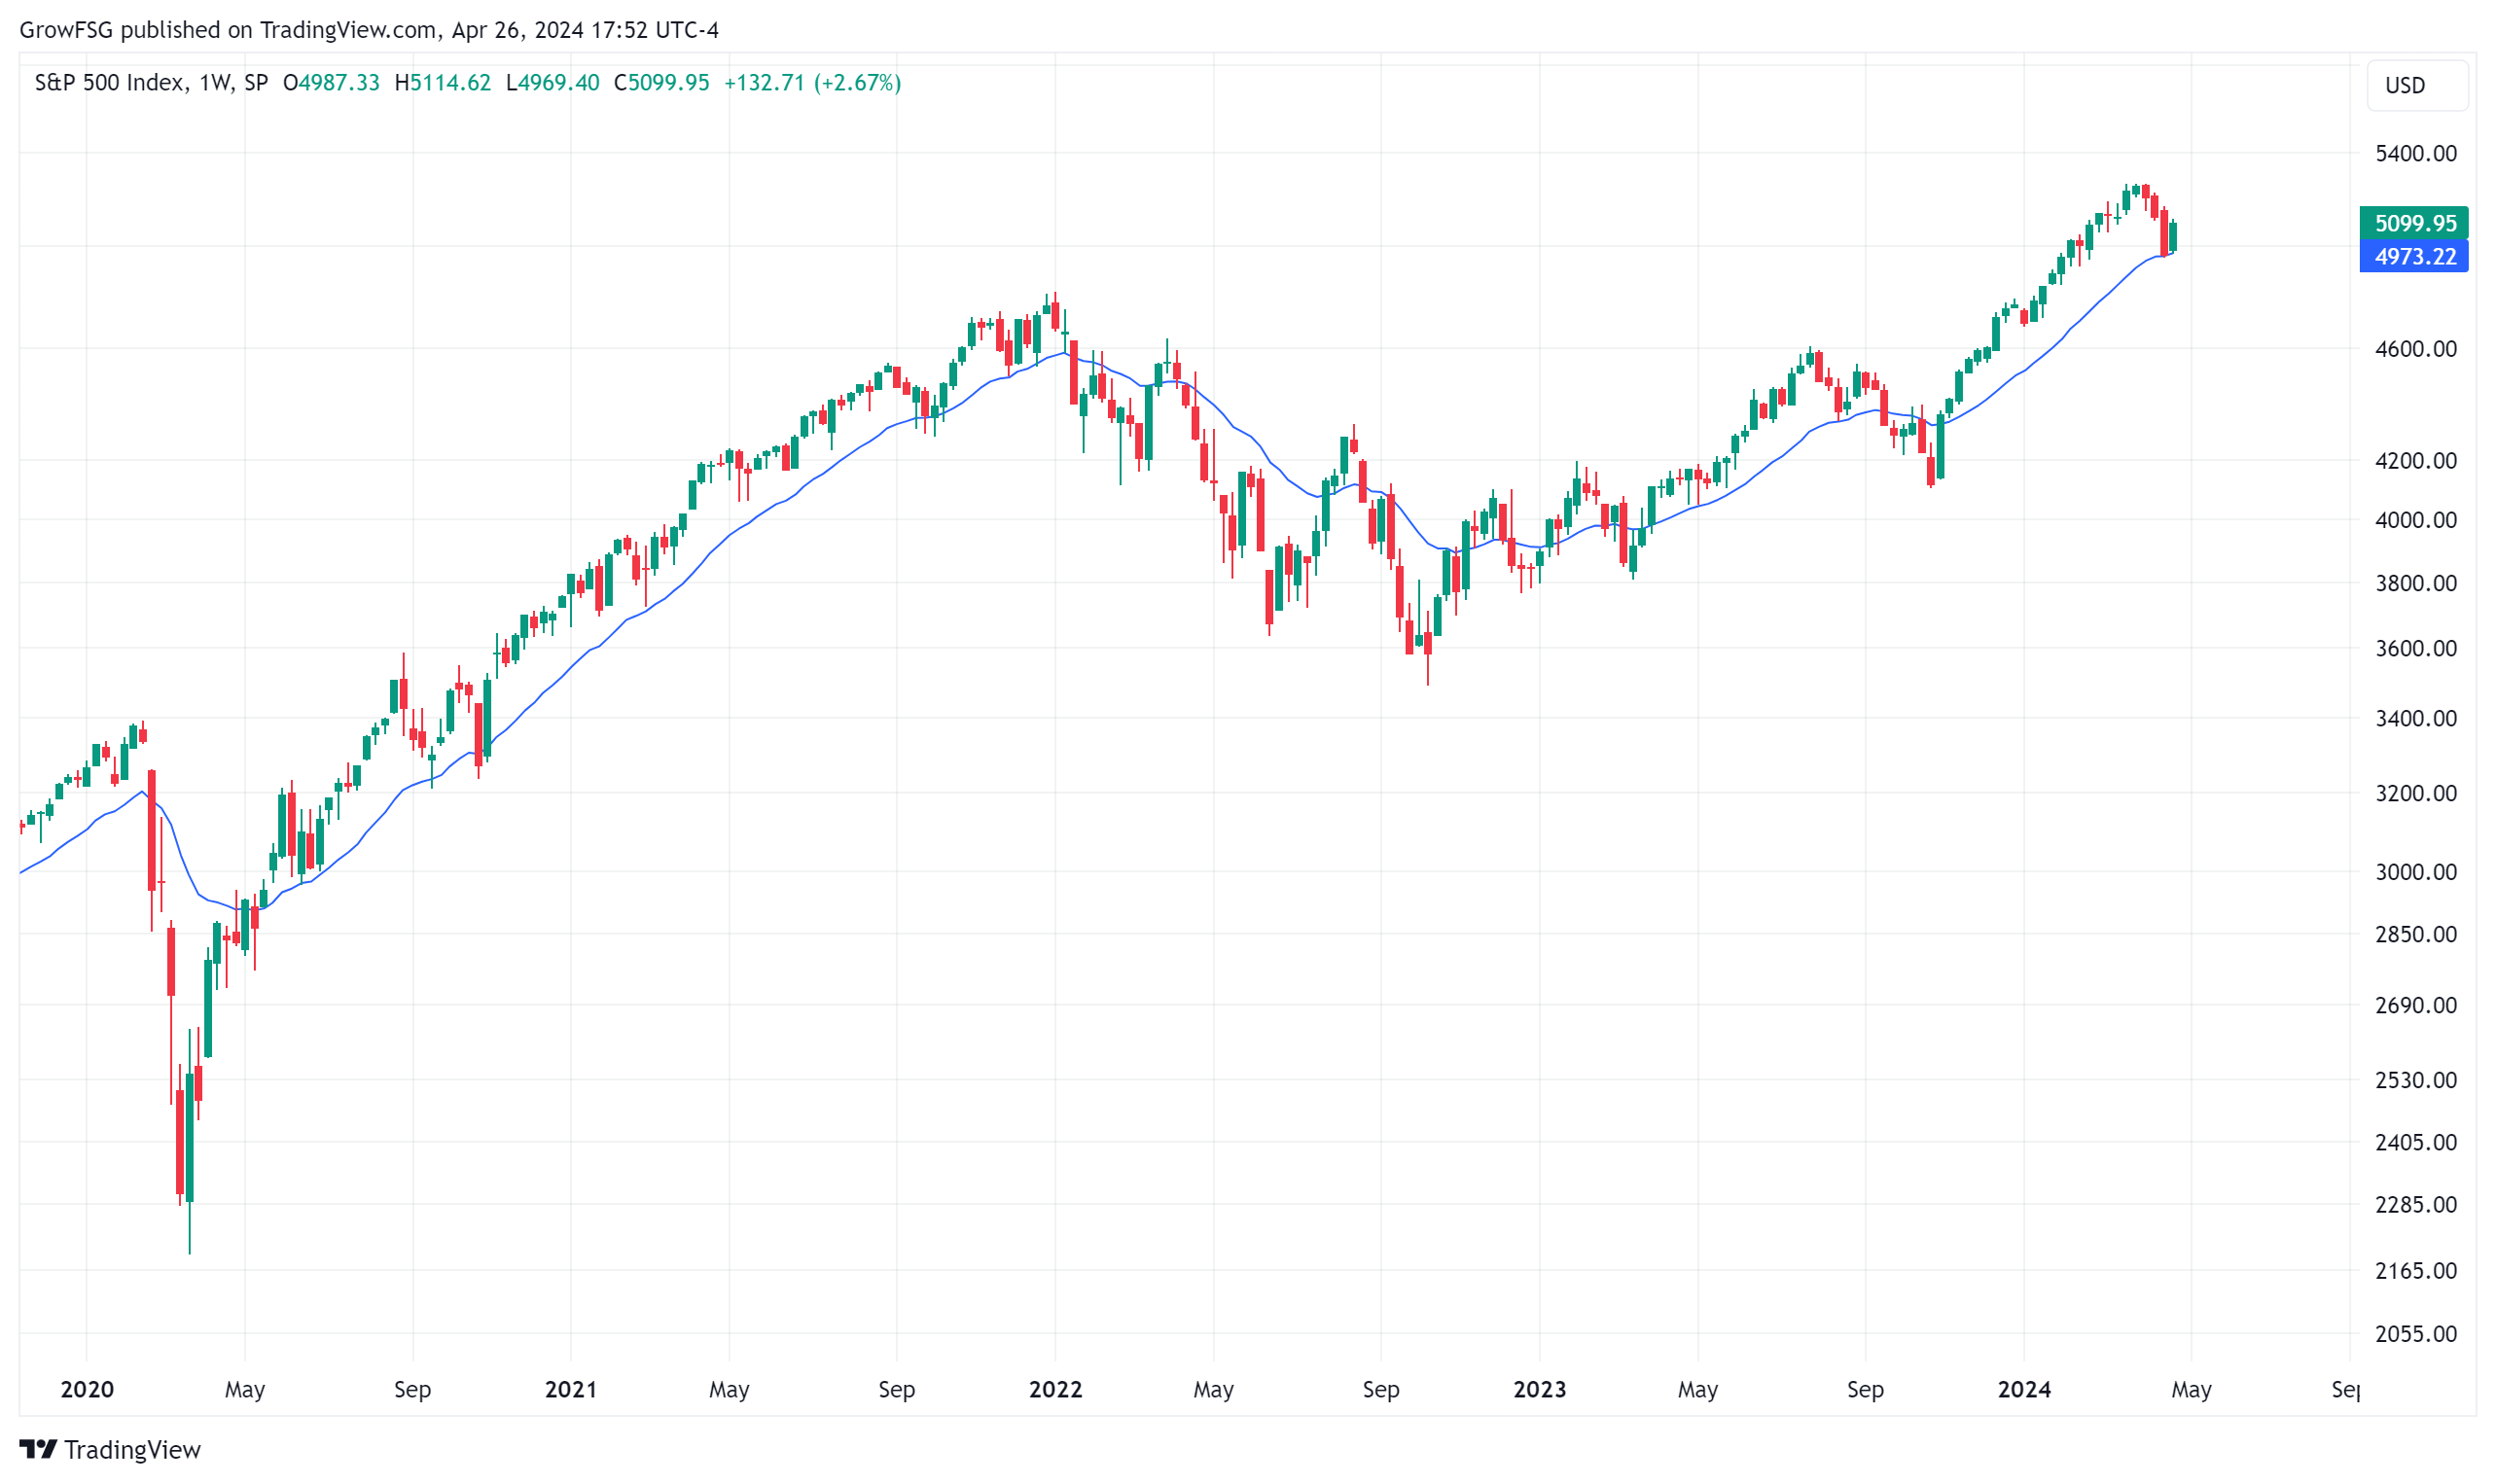
This week was potentially pivotal for the current pullback. Throughout the rally of 2020-2021, the C fund found support at its 20 Week Moving Average (WMA) line. Since the October 2022 bottom, the 200WMA has not been a valuable tool in terms of support or resistance. This week, the C fund confirmed last week's support at the 200WMA and closed at the top of the week's trading range. The last time we saw this type of support at the 20WMA was the May and September 2020 pullbacks. Higher highs from here would confirm a continuation of the rally that began in October 2022.
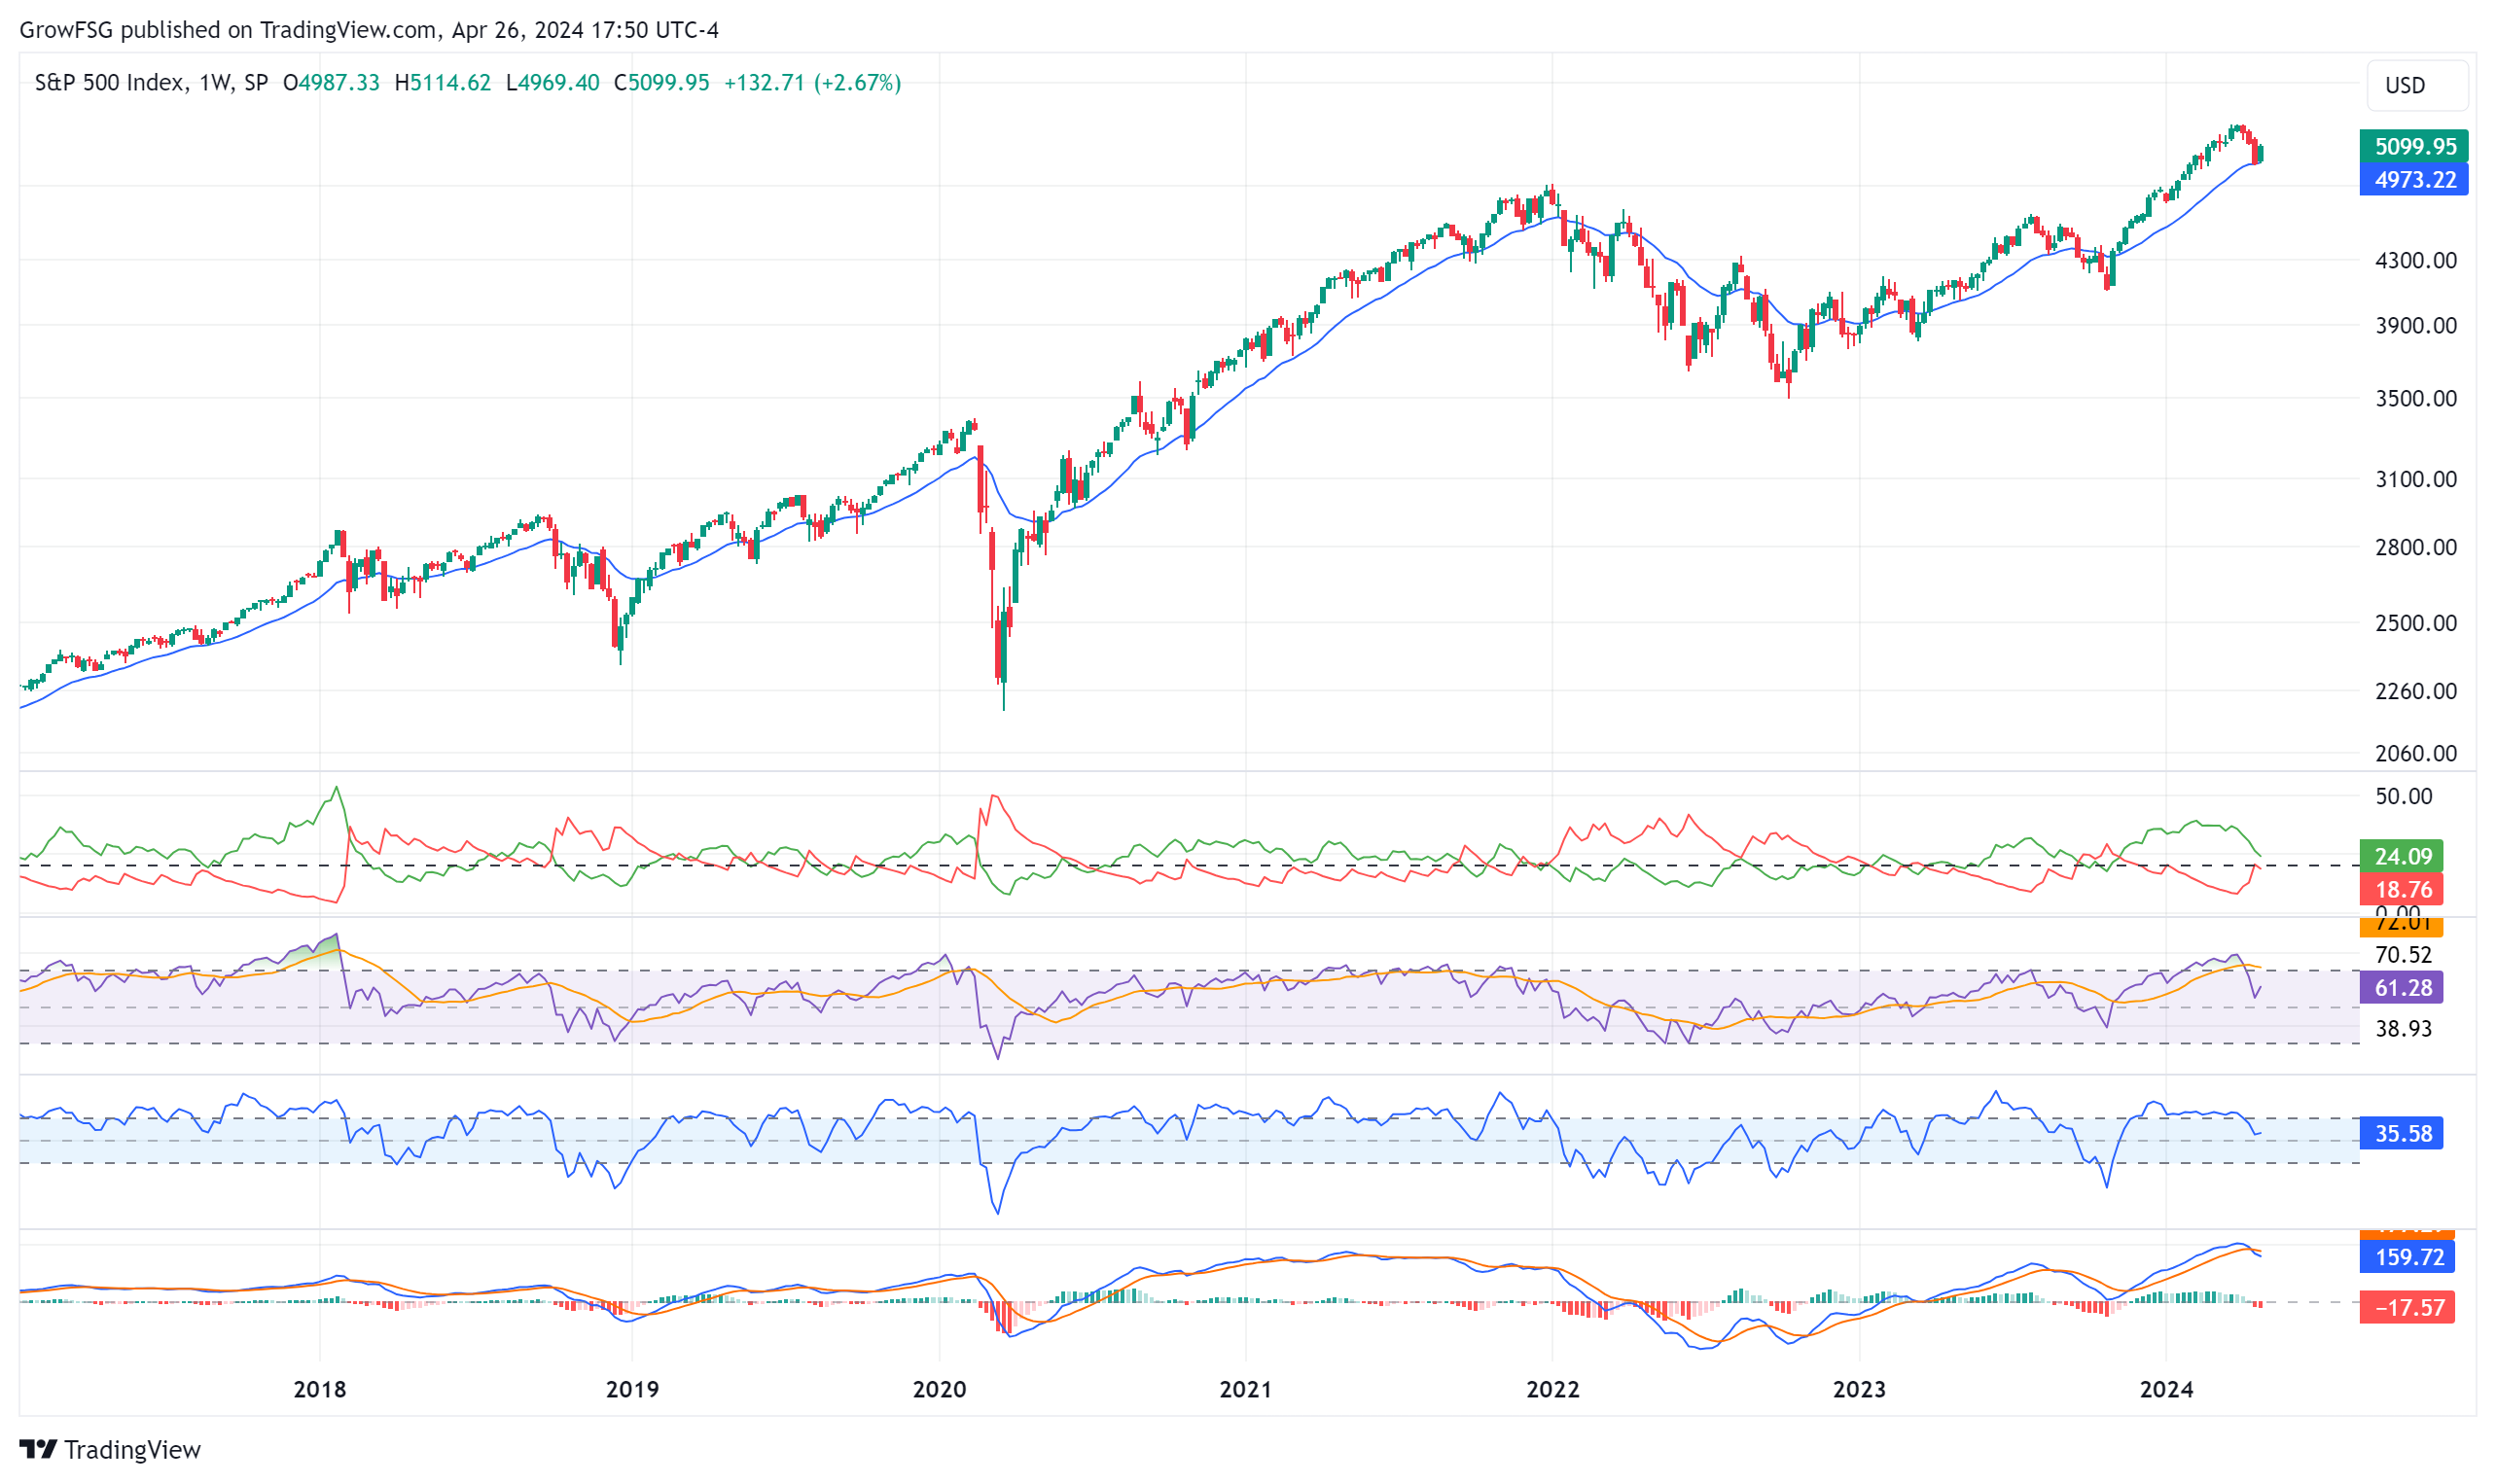
If we apply the technical analysis stack to the weekly C fund chart, we can make some interesting comparisons between price action in 2024 vs 2018. In both cases, price was extended above the 20WMA, ADX sellers were oversold, and RSI was above 70. Over the past few weeks, we have seen price collapse down to the 20WMA, along with a sharp rise in ADX sellers; similar to 2018. What's critical is support at the 50 RSI line.
In 2018, we see support at the 50 RSI line for several months before the rally continued. Price actually carved out a triangle consolidation pattern before moving to new highs. In 2024, we are at a juncture. Price found support at the 20WMA line and 50 RSI line. If support holds, we could see a V pullback, and on to new highs, as we saw throughout 2021. We could see price trace out some kind of consolidation pattern like we saw in 2018. If support fails, we could be in the early stages of a correction like late 2018, 2020, and 2022.
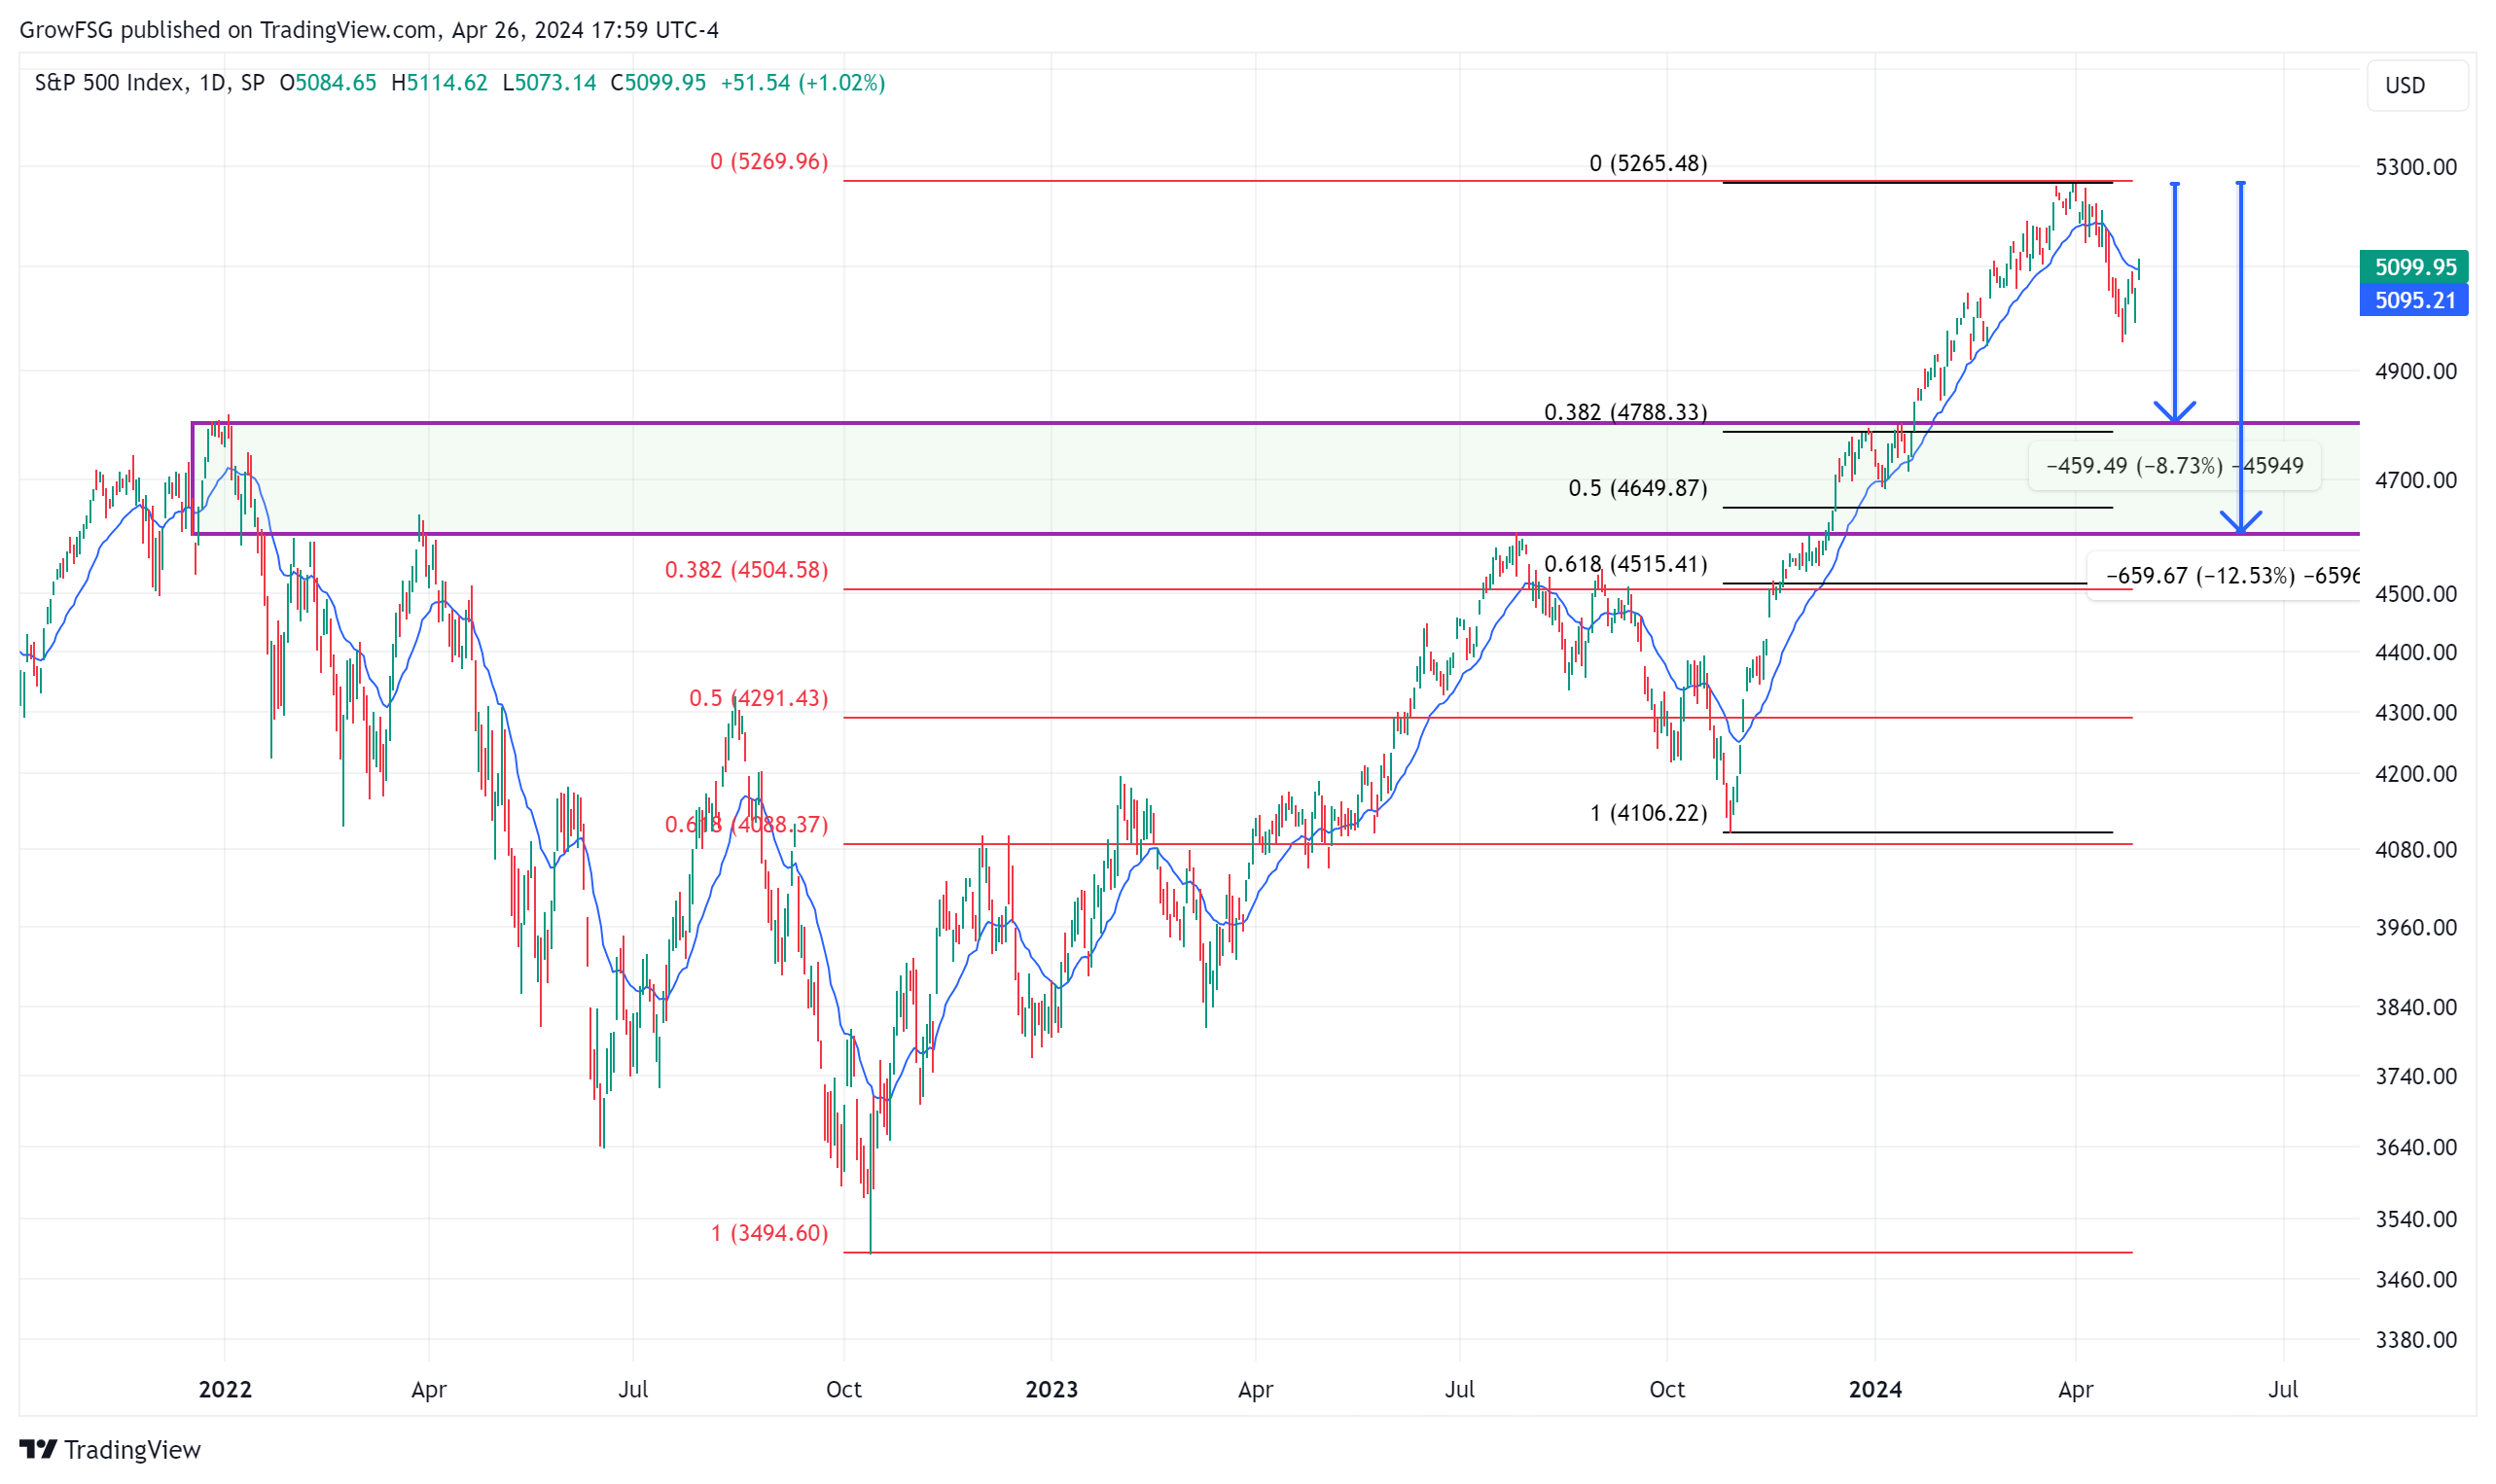
If we drill down to the daily support/resistance chart, we can see that it hasn't changed much this week. The first downside target is approximately 4800; the 38% retracement of the last rally and the 2022 high. If support at the 4800 level fails, the lower channel line at 4600 and last summer's peak needs to hold. Below 4600 would be a likely failure of the rally that began at the October 2022 bottom.
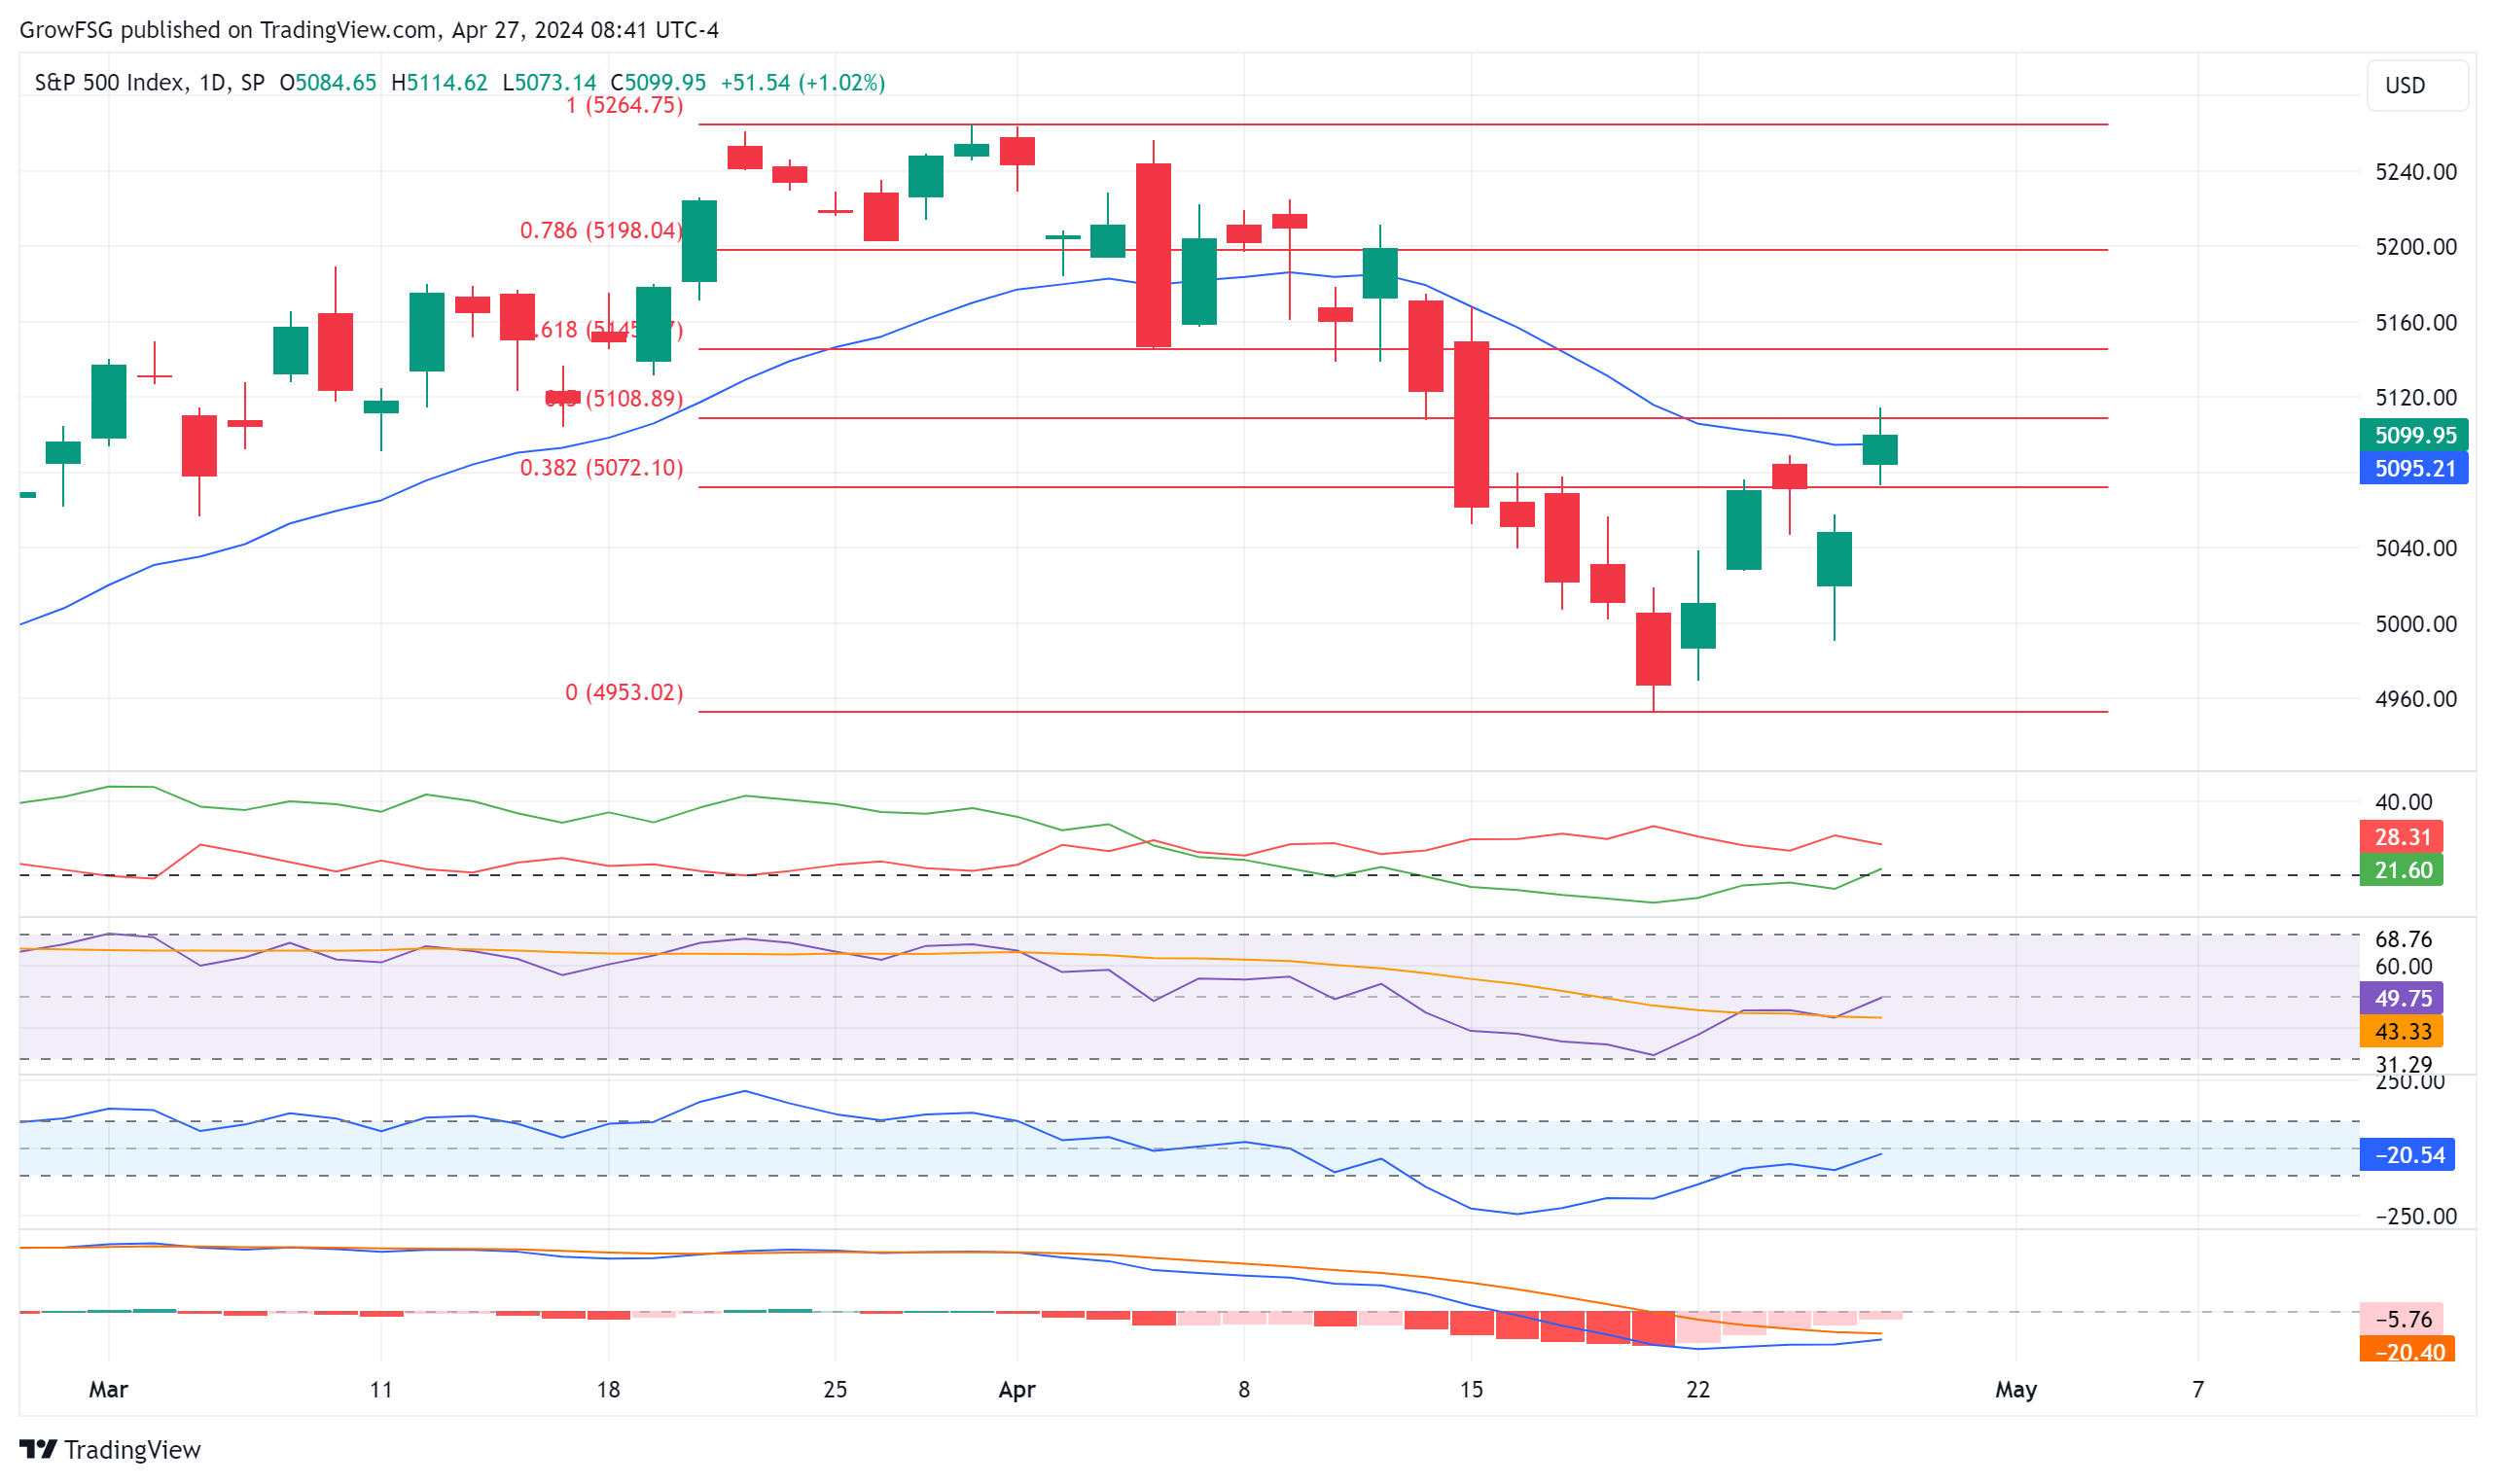
At this point, we have a swing high at the late March peak and a swing low on 19 April. Until price breaks out of this range, we will not have a confirmation of the next long term direction. We expect a correction down to 4800 but, a V bottom is also a possibility. A V bottom is confirmed if price closes above 5265. For the correction to continue, we expect price to reverse at one of the Fibonacci retracement levels of the recent pullback. On Friday, price hit resistance at the 50% level and pulled back to close just above the 20DMA line. The bulls want to see price get above 5200 in the short term. The bears want a solid reversal day next week. The technical indicators are trending higher but have yet to give us a buy signal, with RSI still below 50, CCI below 0, and MACD still negative.
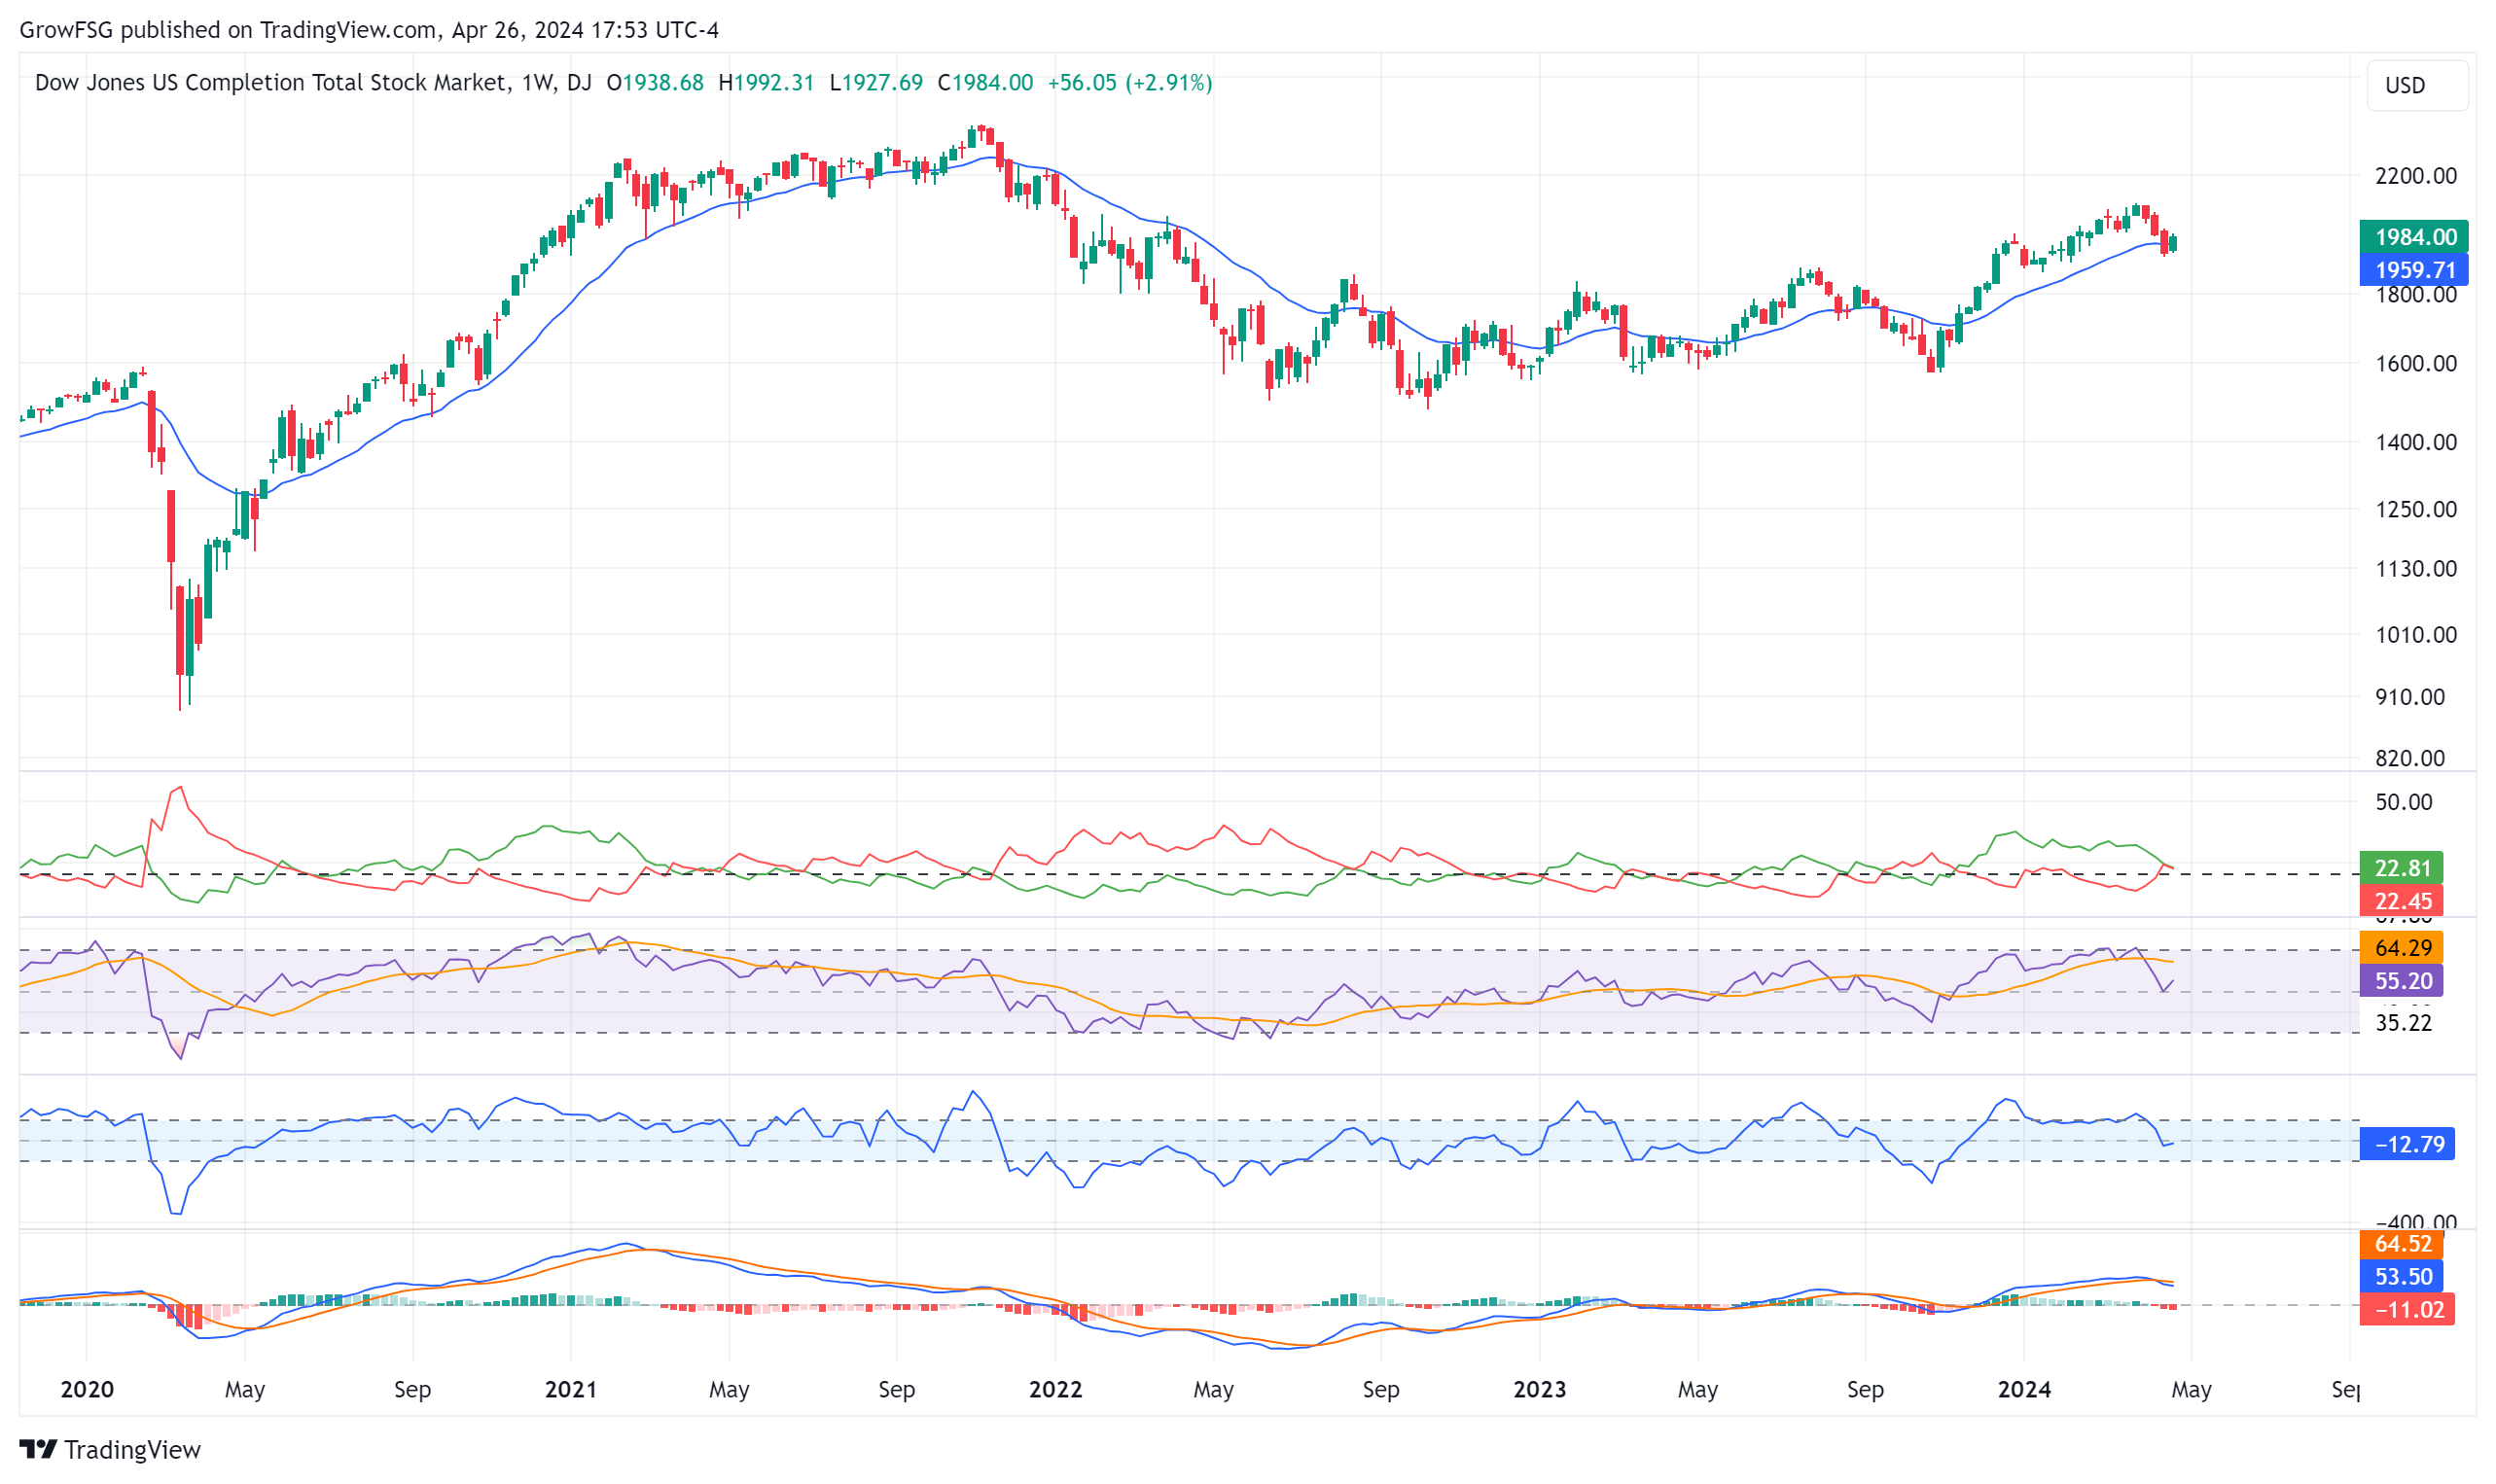
The weekly chart of the S fund shows the value of the 20WMA. This moving average line provided support for price from May 2020 through late 2021. Once support failed, the 20WMA was resistance for price during the 2022 bear market. Price is testing the 20WMA once again. The bulls want support to hold here. The bears want support to fail and price to put in lower lows. Weekly RSI is currently 55. For the rally to continue, we need to see that 50 RSI line hold.
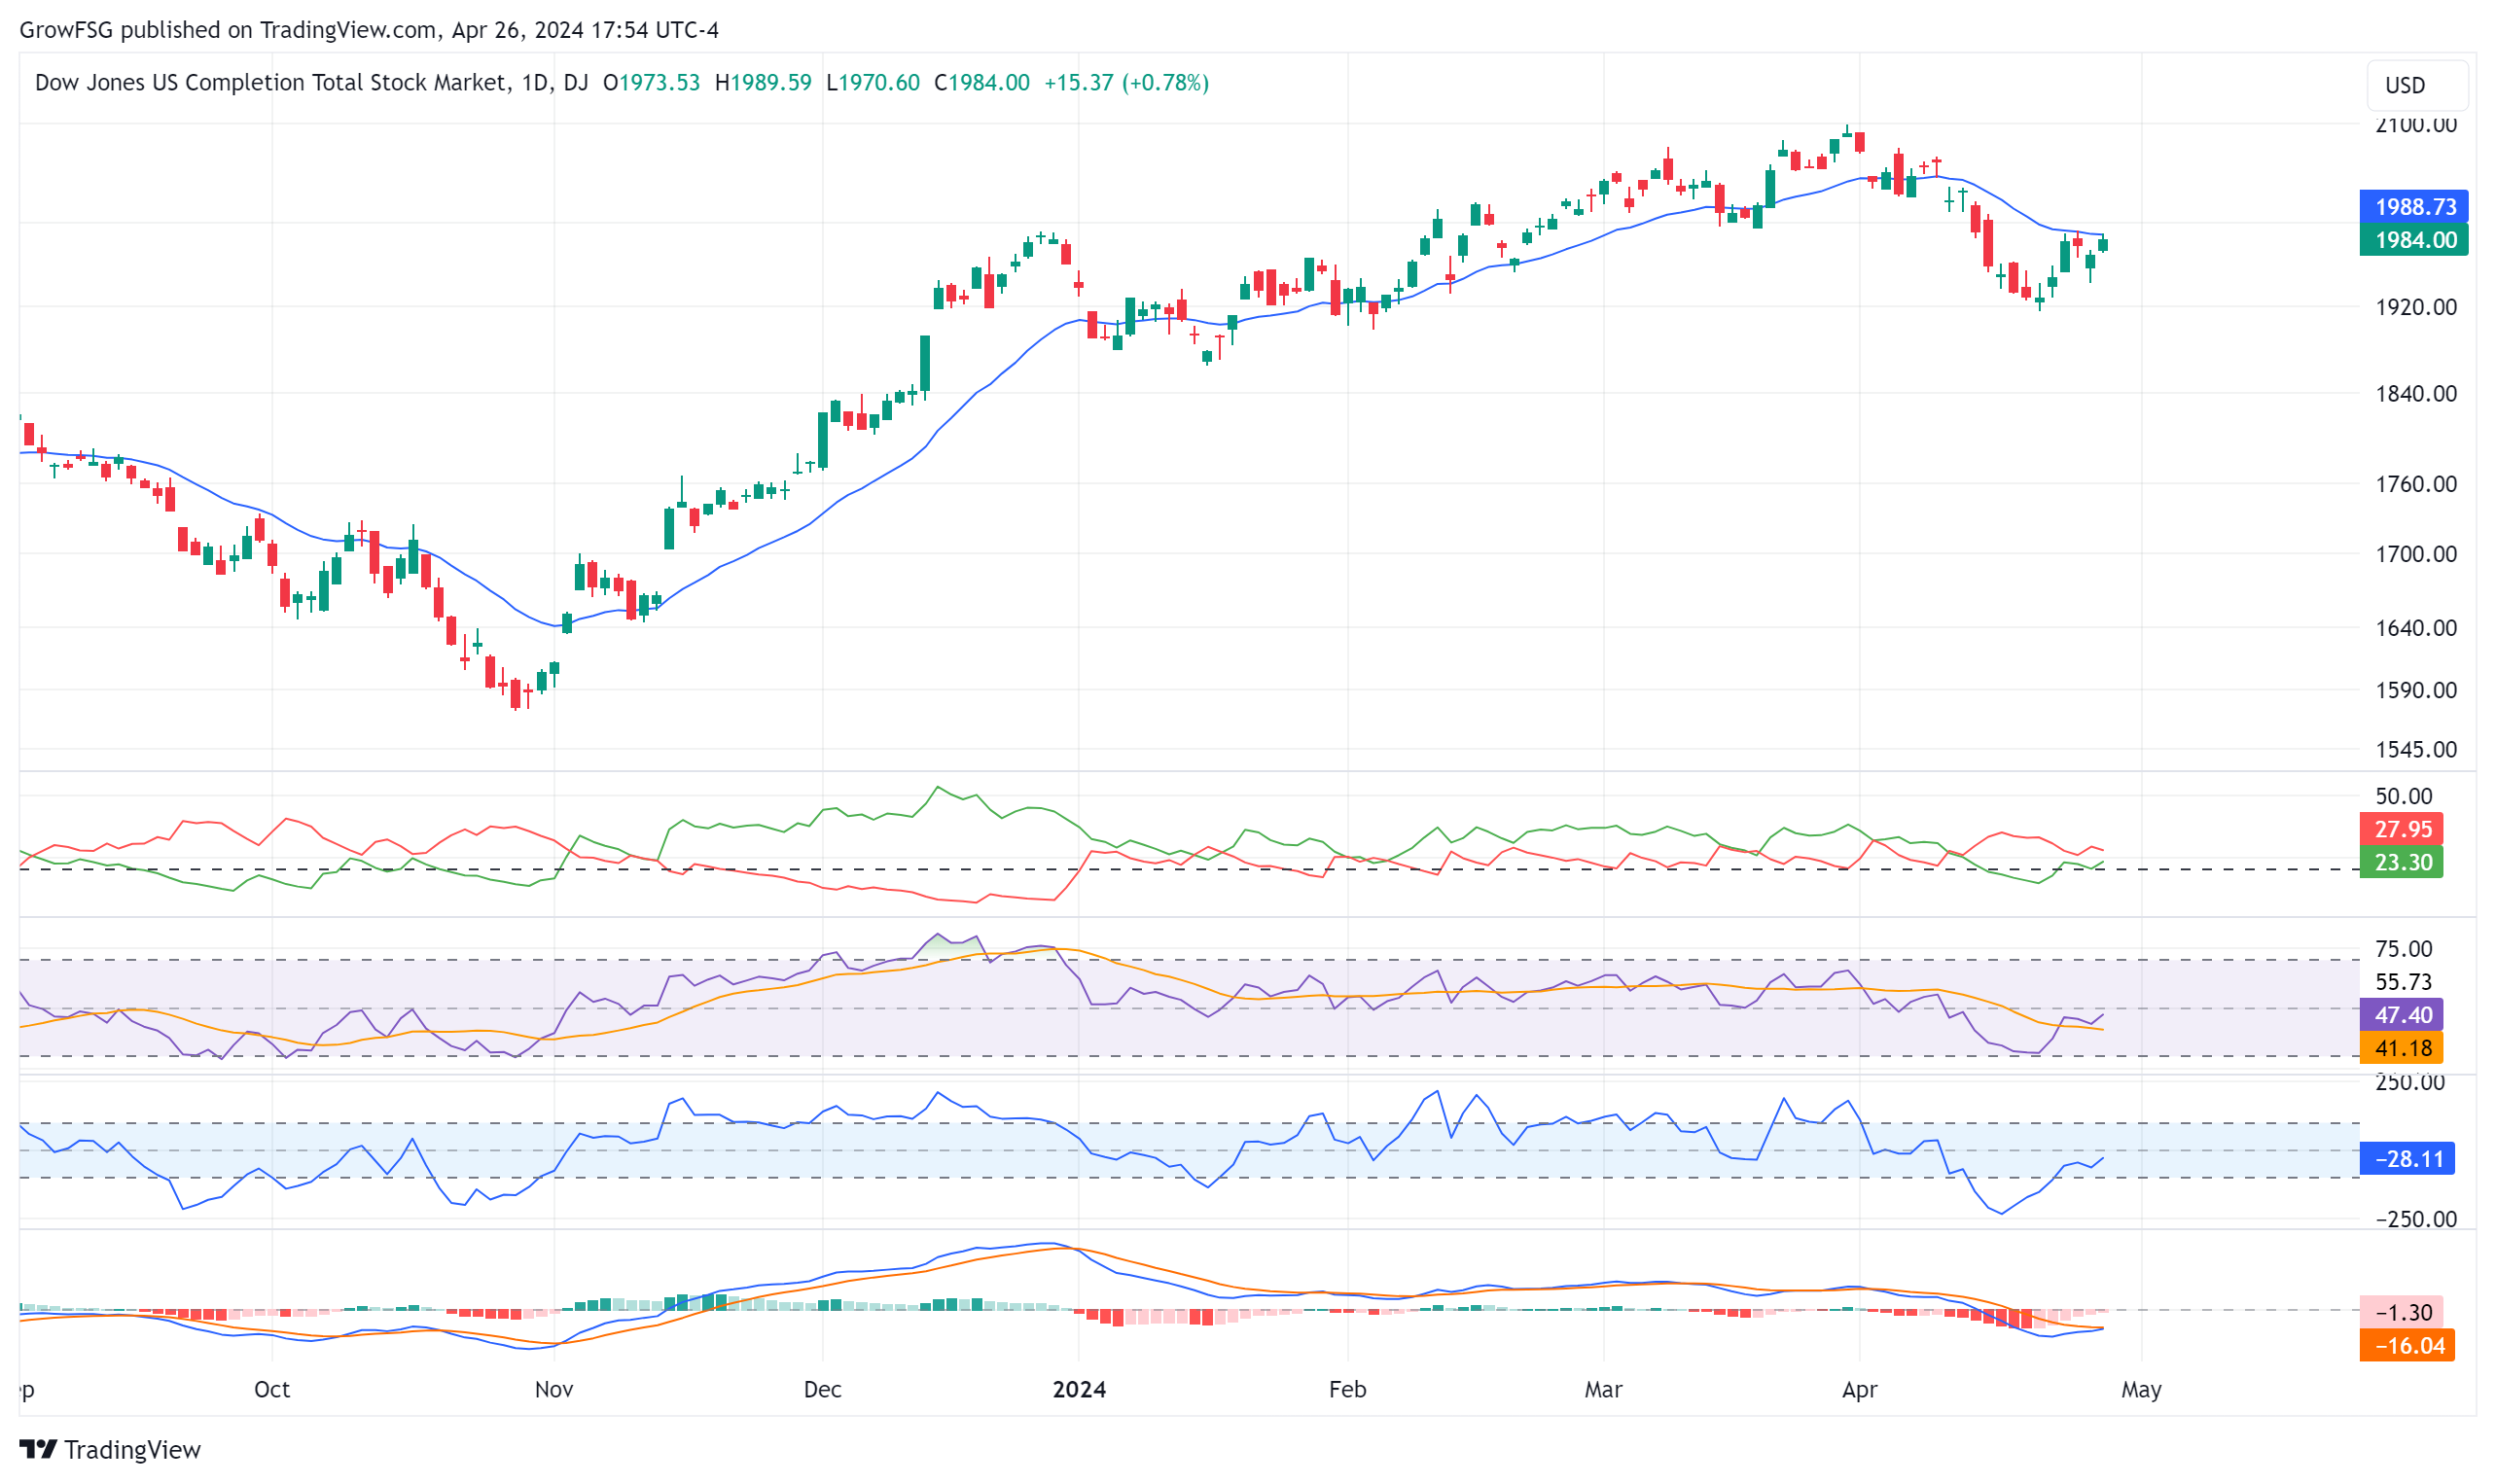
The weekly chart of the S fund is much more constructive than the daily chart. The 20DMA generally provided support since the November 2023 breakout. Support clearly failed on 12 April. The S fund bottomed on 19 April and has hit resistance at its 20DMA for the past 4 days. Bulls want to see a breakout through the 20DMA. Bears want to see resistance hold and a reversal to close below the 19 April low. The technical indicators are firming up for an upside breakout. Next week should be telling for the S fund.
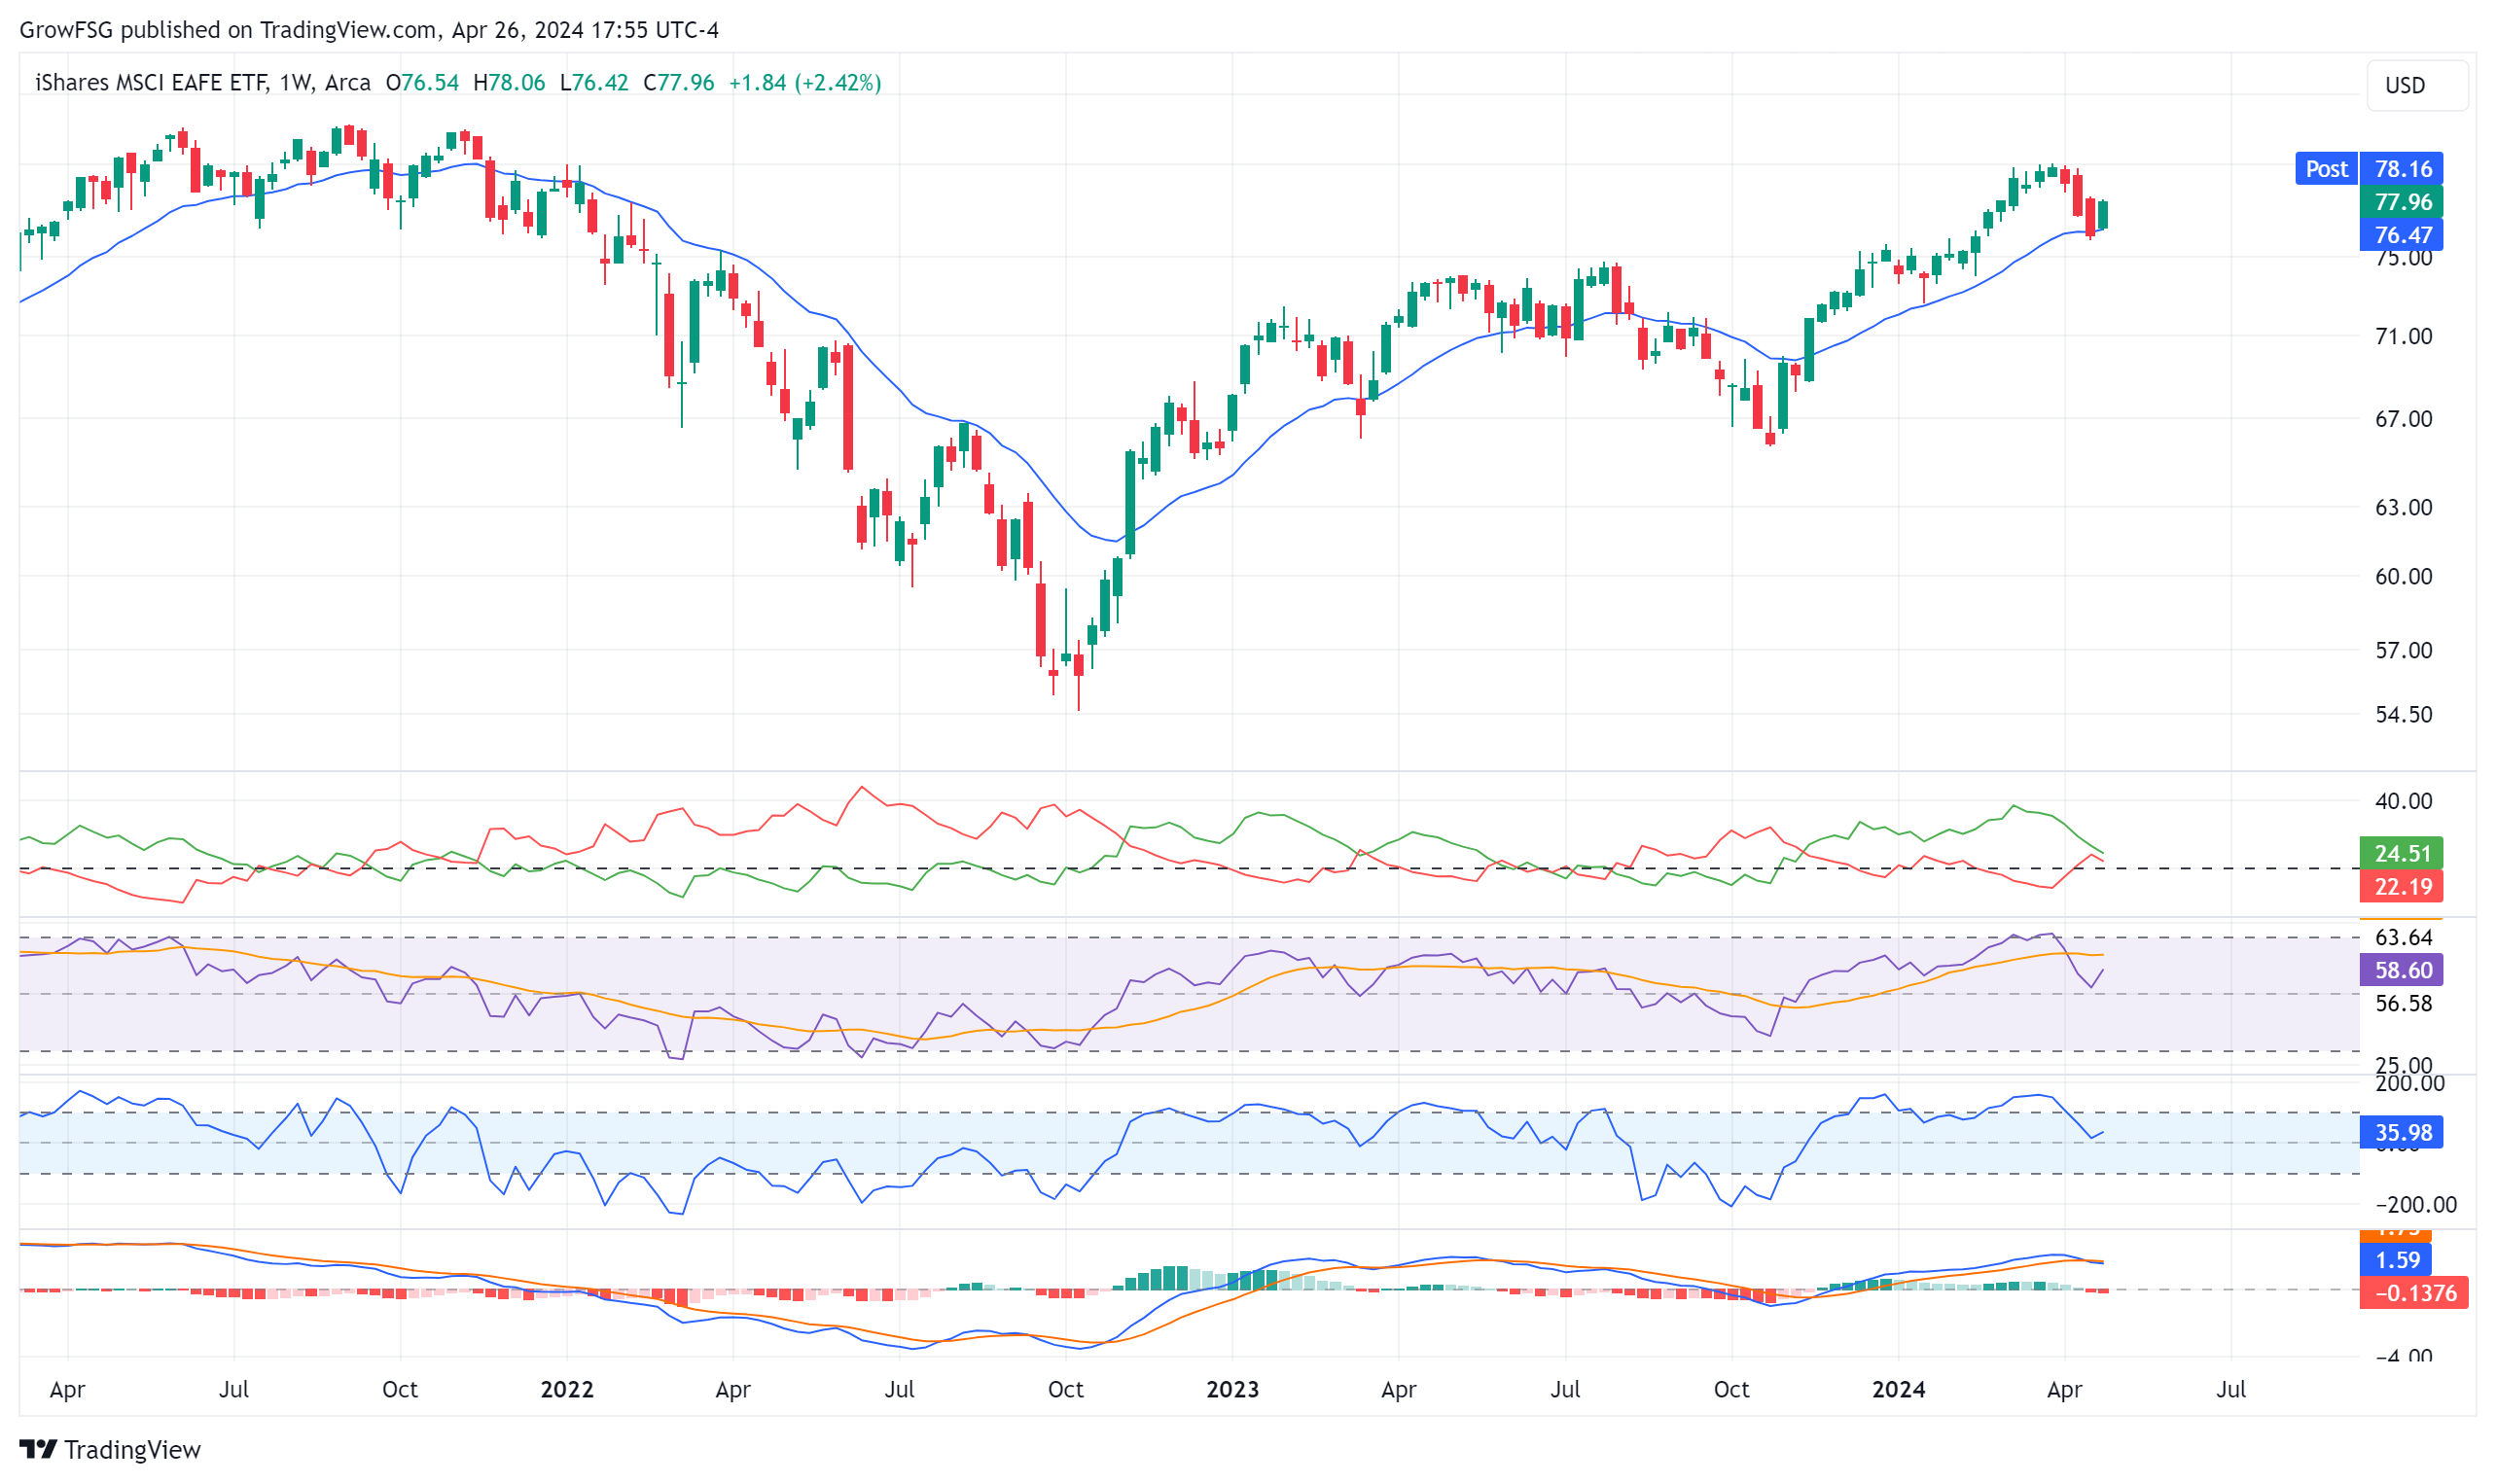
The weekly chart of the I fund also shows the value of the 20WMA. Since the November 2023 breakout, price has tested the 20WMA three times, including last week. For now, support looks to be holding. The bulls want to see a weekly close above 78.25. The bears want a close below 76. There is also a lot of support at the 75 level.
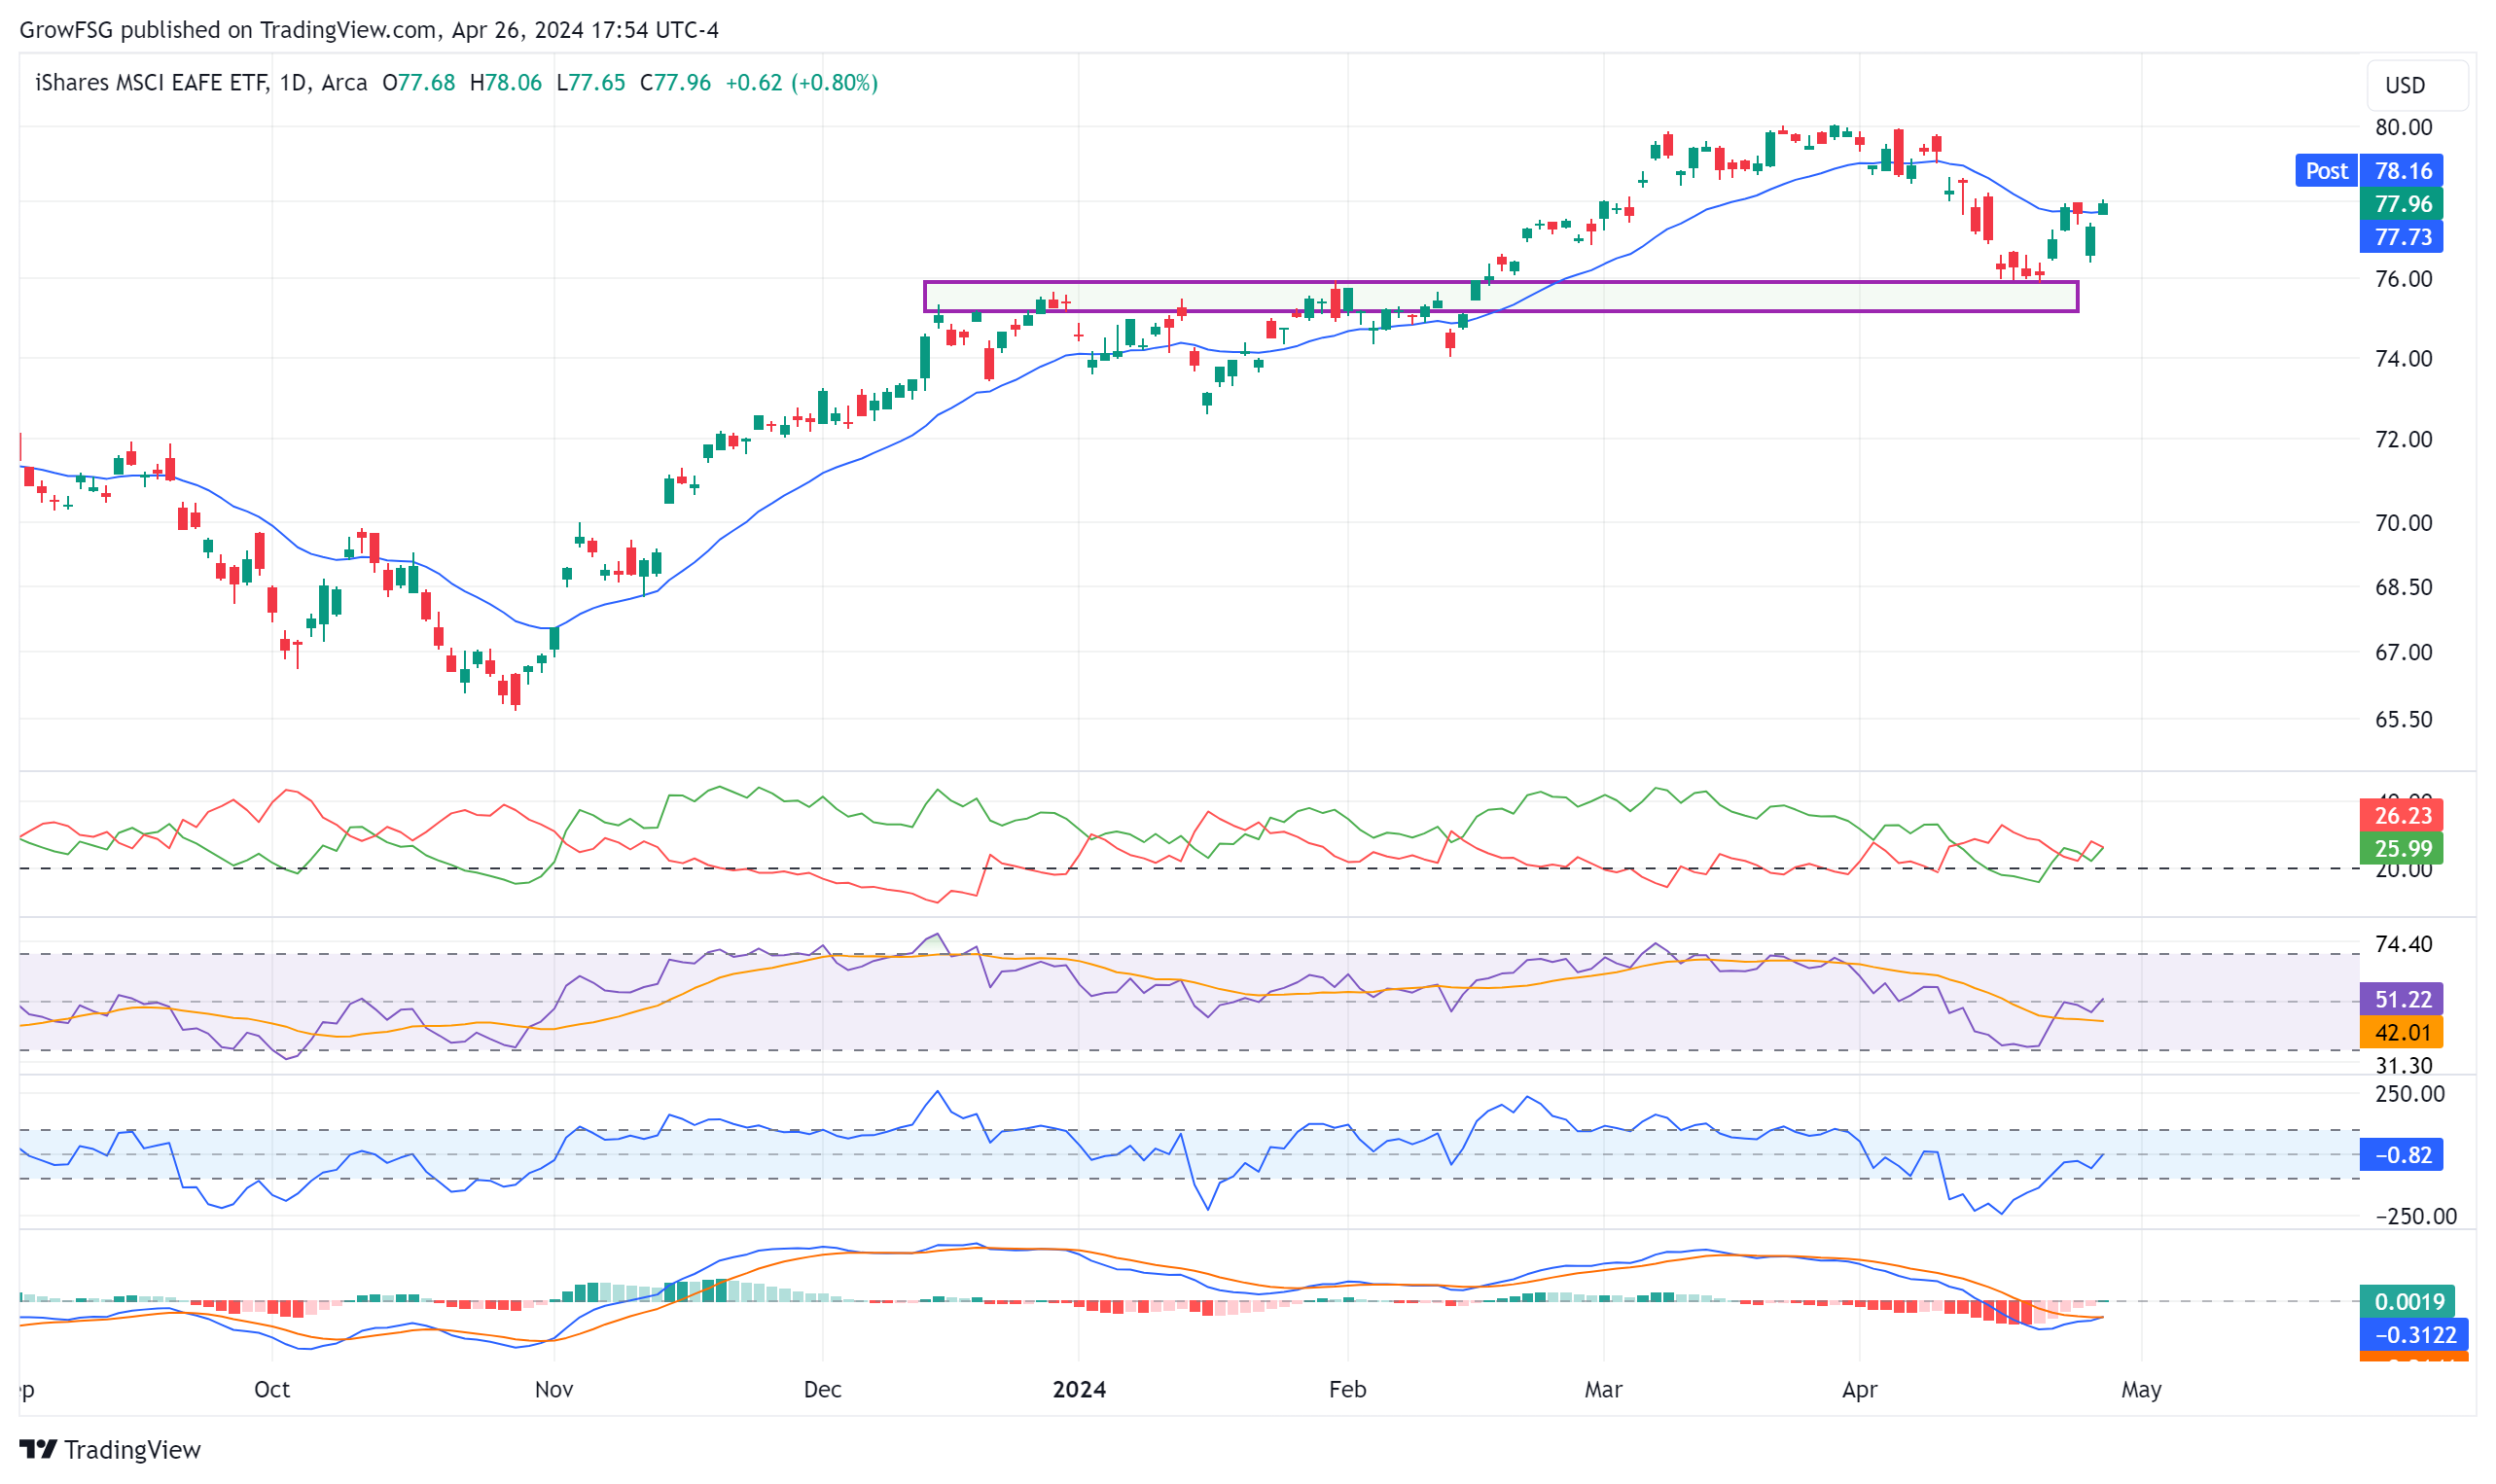
The daily chart of the I fund shows the same bull/bear struggle as the S fund. After four days of support at 76, price rallied to resistance at the 20DMA for the past four days. Price is now in a very tight short-term trading range. A daily close above 78 would likely give us a buy trigger for the I fund. A daily close below the channel would mean another leg lower for the I fund. Again, this coming week should be telling.
The F fund and the 10 year yield chart are very important right now. The weekly chart shows a 5 wave pattern down from the 2020 peak to the October 2022 bottom. The F fund is setting up for its next significant move higher. How price plays out during that move will tell us the next long-term direction for the F fund.
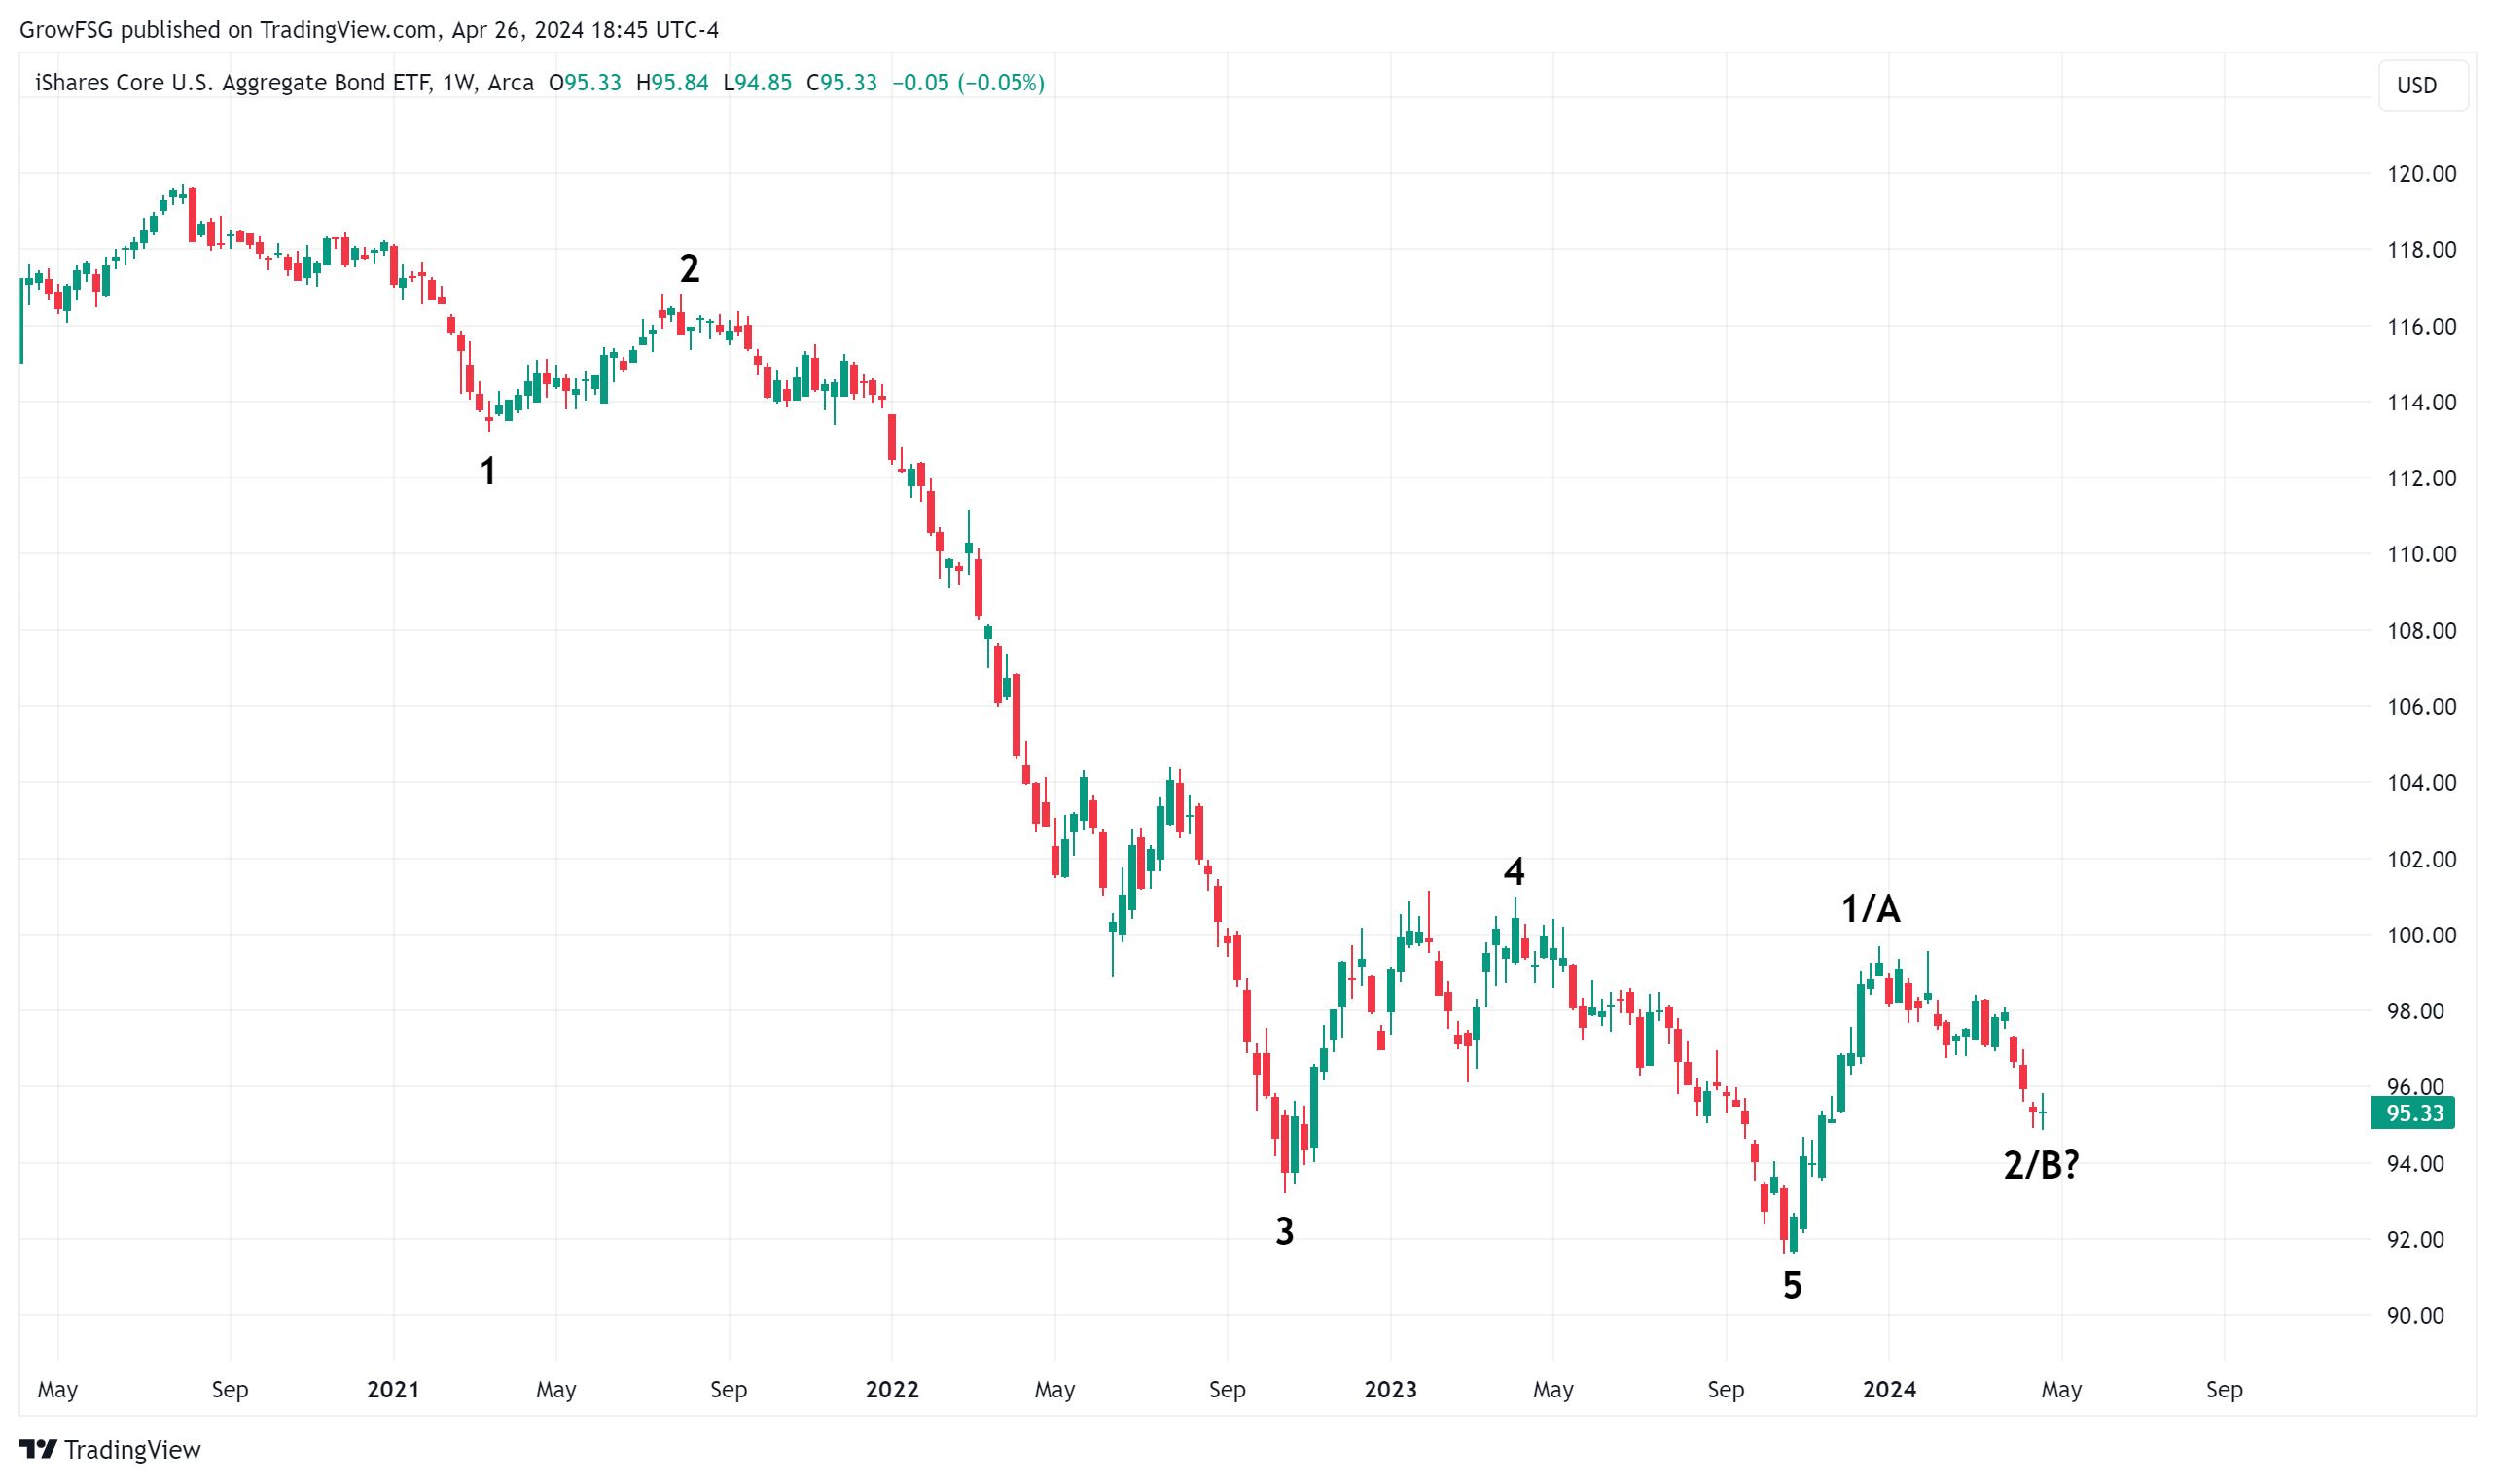
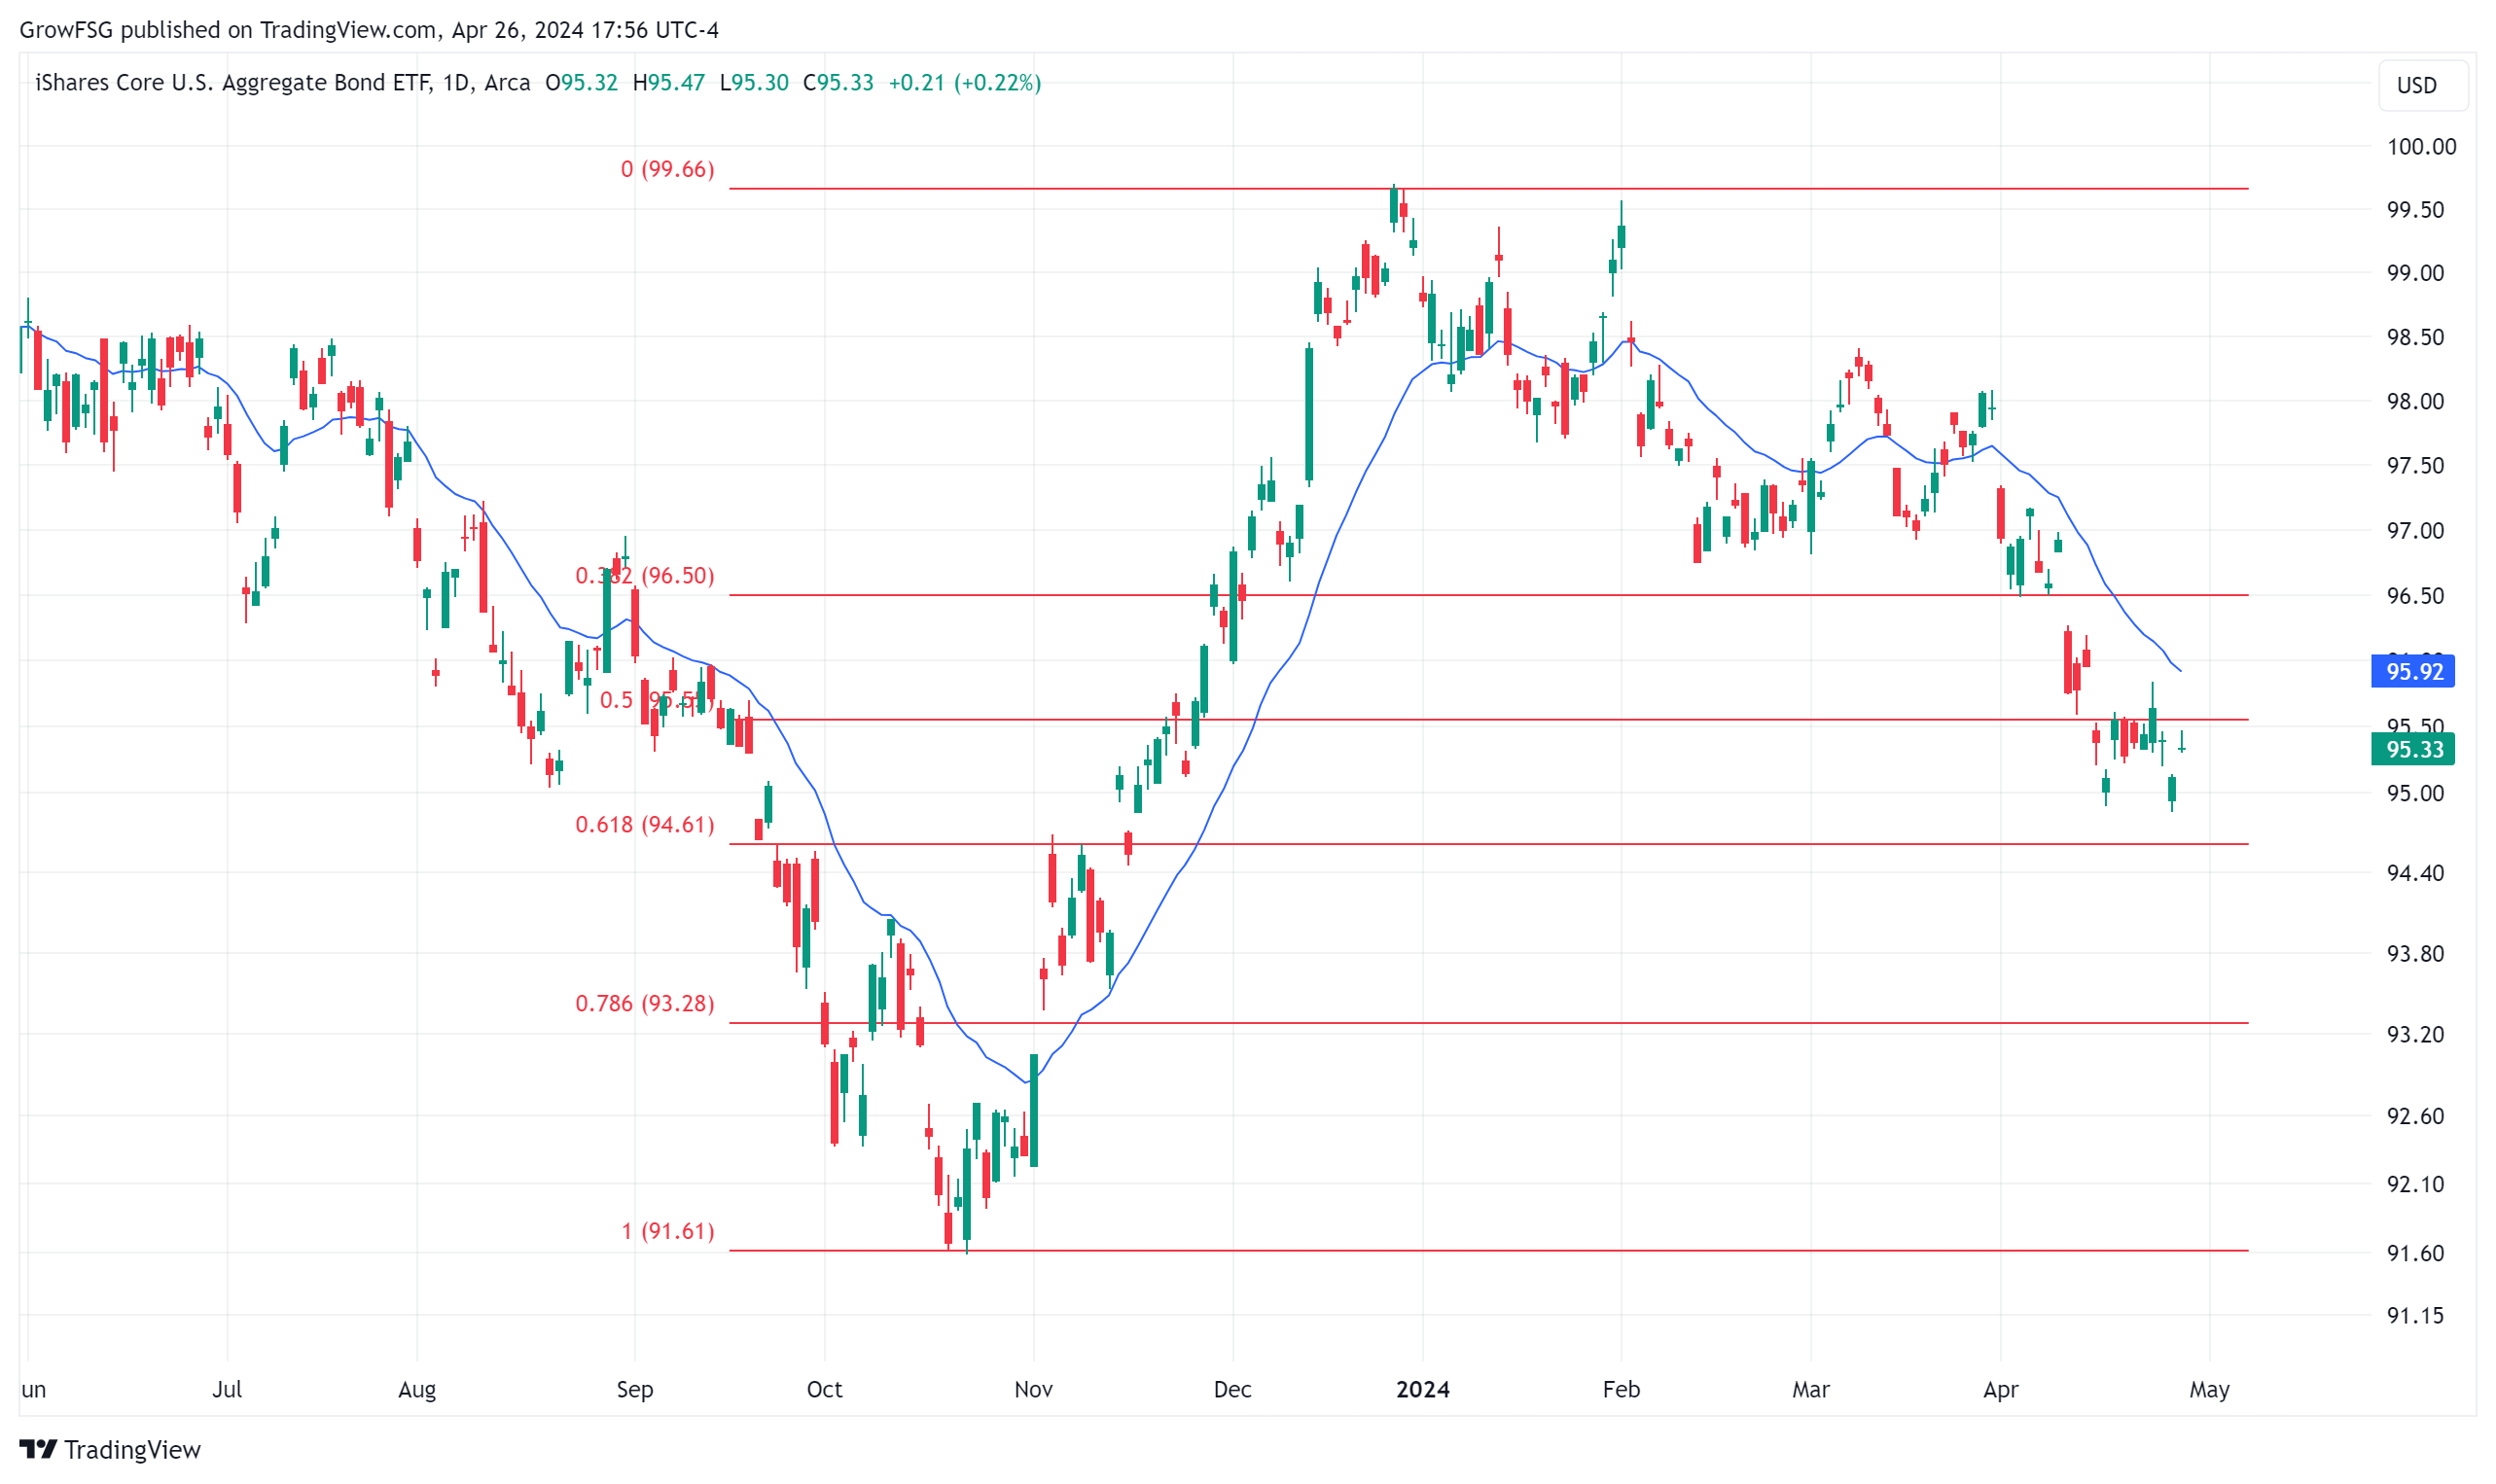
We expect price to find support at one of the Fibonacci retracement levels of the late 2023 rally. We've seen a clear A-B-C corrective pattern since the December peak. A breakout from support at the 62% retracement level would be ideal. IF price falls below 91.60 then the long-term 5 wave pattern has failed. While very unlikely, it is a possibility.
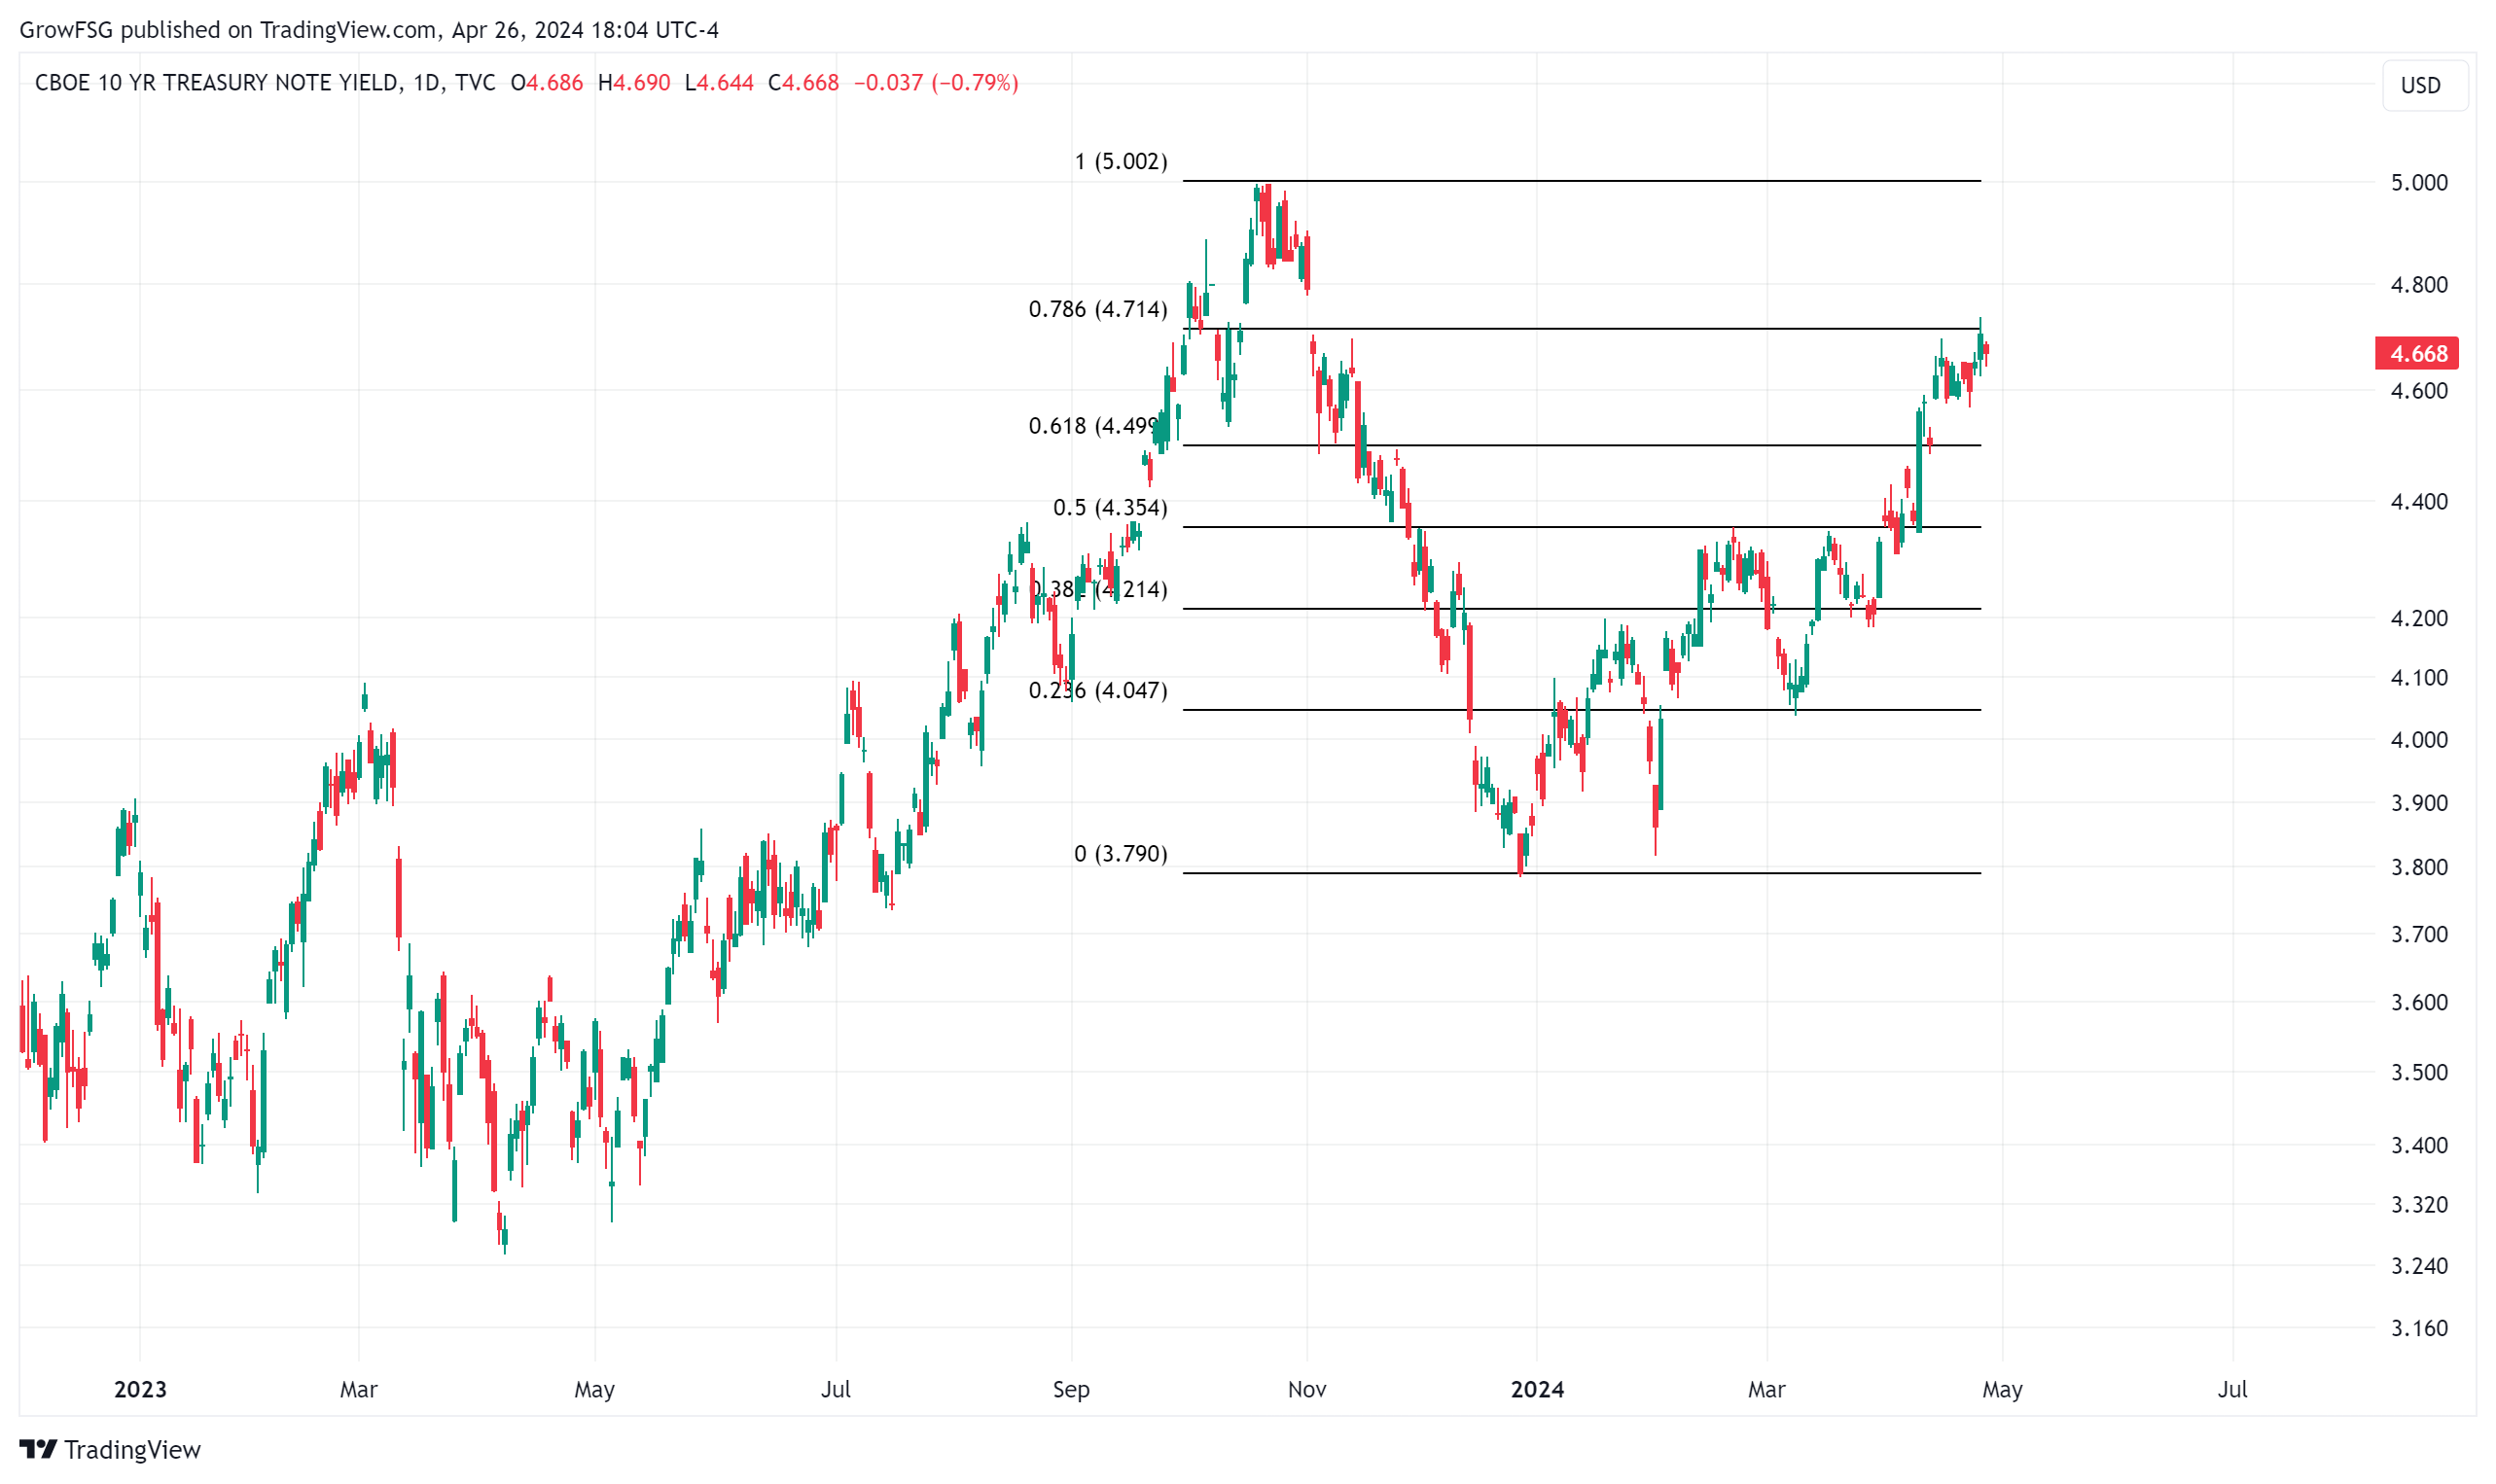
The price of the 10 year yield is what's driving the F fund. The 10 year yield hit resistance at its 78.6 retracement level last week. If yield continues higher and takes out 5%, the F fund will fall to new historic lows. It's very close to do or die for bond prices at this point...
Have a great week!
The Grow My TSP Team
This week was potentially pivotal for the current pullback. Throughout the rally of 2020-2021, the C fund found support at its 20 Week Moving Average (WMA) line. Since the October 2022 bottom, the 200WMA has not been a valuable tool in terms of support or resistance. This week, the C fund confirmed last week's support at the 200WMA and closed at the top of the week's trading range. The last time we saw this type of support at the 20WMA was the May and September 2020 pullbacks. Higher highs from here would confirm a continuation of the rally that began in October 2022.
If we apply the technical analysis stack to the weekly C fund chart, we can make some interesting comparisons between price action in 2024 vs 2018. In both cases, price was extended above the 20WMA, ADX sellers were oversold, and RSI was above 70. Over the past few weeks, we have seen price collapse down to the 20WMA, along with a sharp rise in ADX sellers; similar to 2018. What's critical is support at the 50 RSI line.
In 2018, we see support at the 50 RSI line for several months before the rally continued. Price actually carved out a triangle consolidation pattern before moving to new highs. In 2024, we are at a juncture. Price found support at the 20WMA line and 50 RSI line. If support holds, we could see a V pullback, and on to new highs, as we saw throughout 2021. We could see price trace out some kind of consolidation pattern like we saw in 2018. If support fails, we could be in the early stages of a correction like late 2018, 2020, and 2022.
If we drill down to the daily support/resistance chart, we can see that it hasn't changed much this week. The first downside target is approximately 4800; the 38% retracement of the last rally and the 2022 high. If support at the 4800 level fails, the lower channel line at 4600 and last summer's peak needs to hold. Below 4600 would be a likely failure of the rally that began at the October 2022 bottom.
At this point, we have a swing high at the late March peak and a swing low on 19 April. Until price breaks out of this range, we will not have a confirmation of the next long term direction. We expect a correction down to 4800 but, a V bottom is also a possibility. A V bottom is confirmed if price closes above 5265. For the correction to continue, we expect price to reverse at one of the Fibonacci retracement levels of the recent pullback. On Friday, price hit resistance at the 50% level and pulled back to close just above the 20DMA line. The bulls want to see price get above 5200 in the short term. The bears want a solid reversal day next week. The technical indicators are trending higher but have yet to give us a buy signal, with RSI still below 50, CCI below 0, and MACD still negative.
The weekly chart of the S fund shows the value of the 20WMA. This moving average line provided support for price from May 2020 through late 2021. Once support failed, the 20WMA was resistance for price during the 2022 bear market. Price is testing the 20WMA once again. The bulls want support to hold here. The bears want support to fail and price to put in lower lows. Weekly RSI is currently 55. For the rally to continue, we need to see that 50 RSI line hold.
The weekly chart of the S fund is much more constructive than the daily chart. The 20DMA generally provided support since the November 2023 breakout. Support clearly failed on 12 April. The S fund bottomed on 19 April and has hit resistance at its 20DMA for the past 4 days. Bulls want to see a breakout through the 20DMA. Bears want to see resistance hold and a reversal to close below the 19 April low. The technical indicators are firming up for an upside breakout. Next week should be telling for the S fund.
The weekly chart of the I fund also shows the value of the 20WMA. Since the November 2023 breakout, price has tested the 20WMA three times, including last week. For now, support looks to be holding. The bulls want to see a weekly close above 78.25. The bears want a close below 76. There is also a lot of support at the 75 level.
The daily chart of the I fund shows the same bull/bear struggle as the S fund. After four days of support at 76, price rallied to resistance at the 20DMA for the past four days. Price is now in a very tight short-term trading range. A daily close above 78 would likely give us a buy trigger for the I fund. A daily close below the channel would mean another leg lower for the I fund. Again, this coming week should be telling.
The F fund and the 10 year yield chart are very important right now. The weekly chart shows a 5 wave pattern down from the 2020 peak to the October 2022 bottom. The F fund is setting up for its next significant move higher. How price plays out during that move will tell us the next long-term direction for the F fund.
We expect price to find support at one of the Fibonacci retracement levels of the late 2023 rally. We've seen a clear A-B-C corrective pattern since the December peak. A breakout from support at the 62% retracement level would be ideal. IF price falls below 91.60 then the long-term 5 wave pattern has failed. While very unlikely, it is a possibility.
The price of the 10 year yield is what's driving the F fund. The 10 year yield hit resistance at its 78.6 retracement level last week. If yield continues higher and takes out 5%, the F fund will fall to new historic lows. It's very close to do or die for bond prices at this point...
Bottom Line
The market is in a trading range until either the most recent high or low is taken out on the S&P500 daily chart. On a weekly basis, support at the 20WMA is holding. With the technical indicators turning up, a buy trigger next week is absolutely a possibility. History tells us to expect a rally from late May through early September during election years. Another leg lower for stocks into late May would fit the historical data perfectly but, this most recent pullback may be all we get. Let the price action be your guide!Have a great week!
The Grow My TSP Team
RELATED READS

Copyright Grow Investments, LLC | GrowMyTSP.com
Thrift Savings Plan Disclaimer
Neither growmytsp.com nor any of its partners or representatives is in any way affiliated with the United States Government, The Federal Retirement Thrift Investment Board (FRTIB.gov) or the Thrift Savings Plan (TSP.gov), and any service being offered is not sanctioned by the United States Government, the Federal Retirement Thrift Investment Board or the Thrift Savings Plan.