
TSP Weekly Newsletter
TSP Weekly Newsletter
January 21, 2024
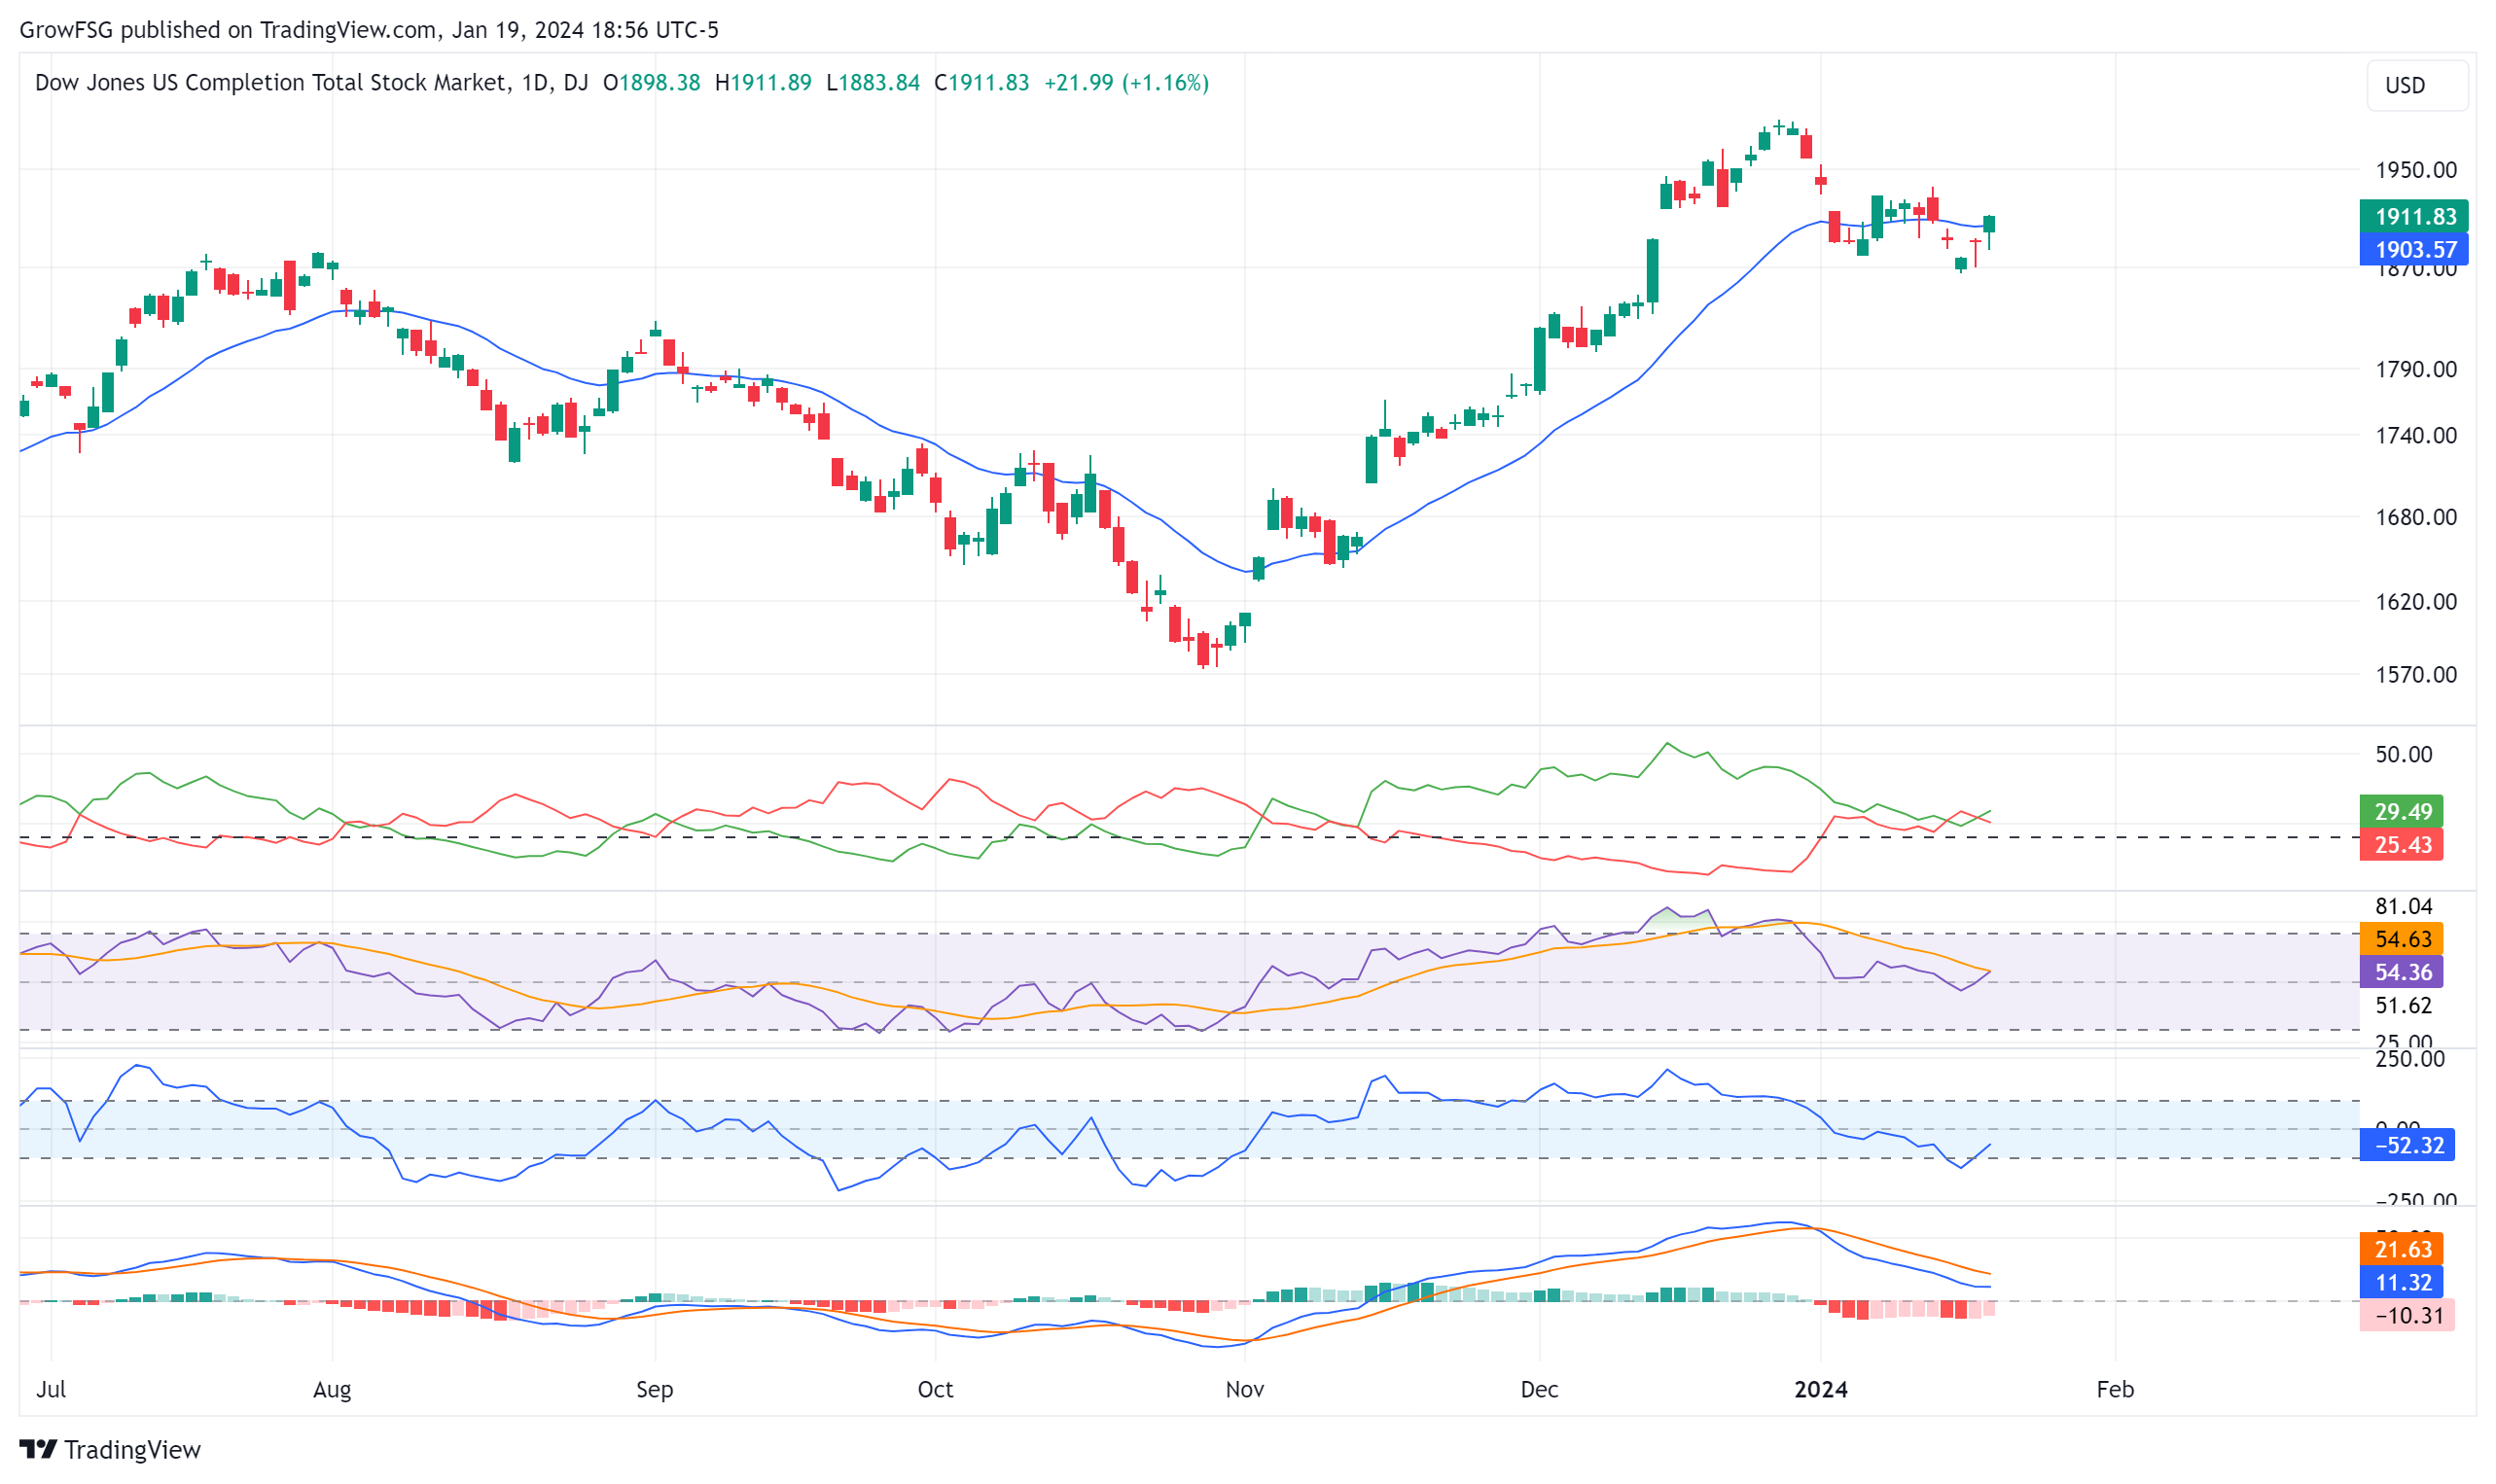
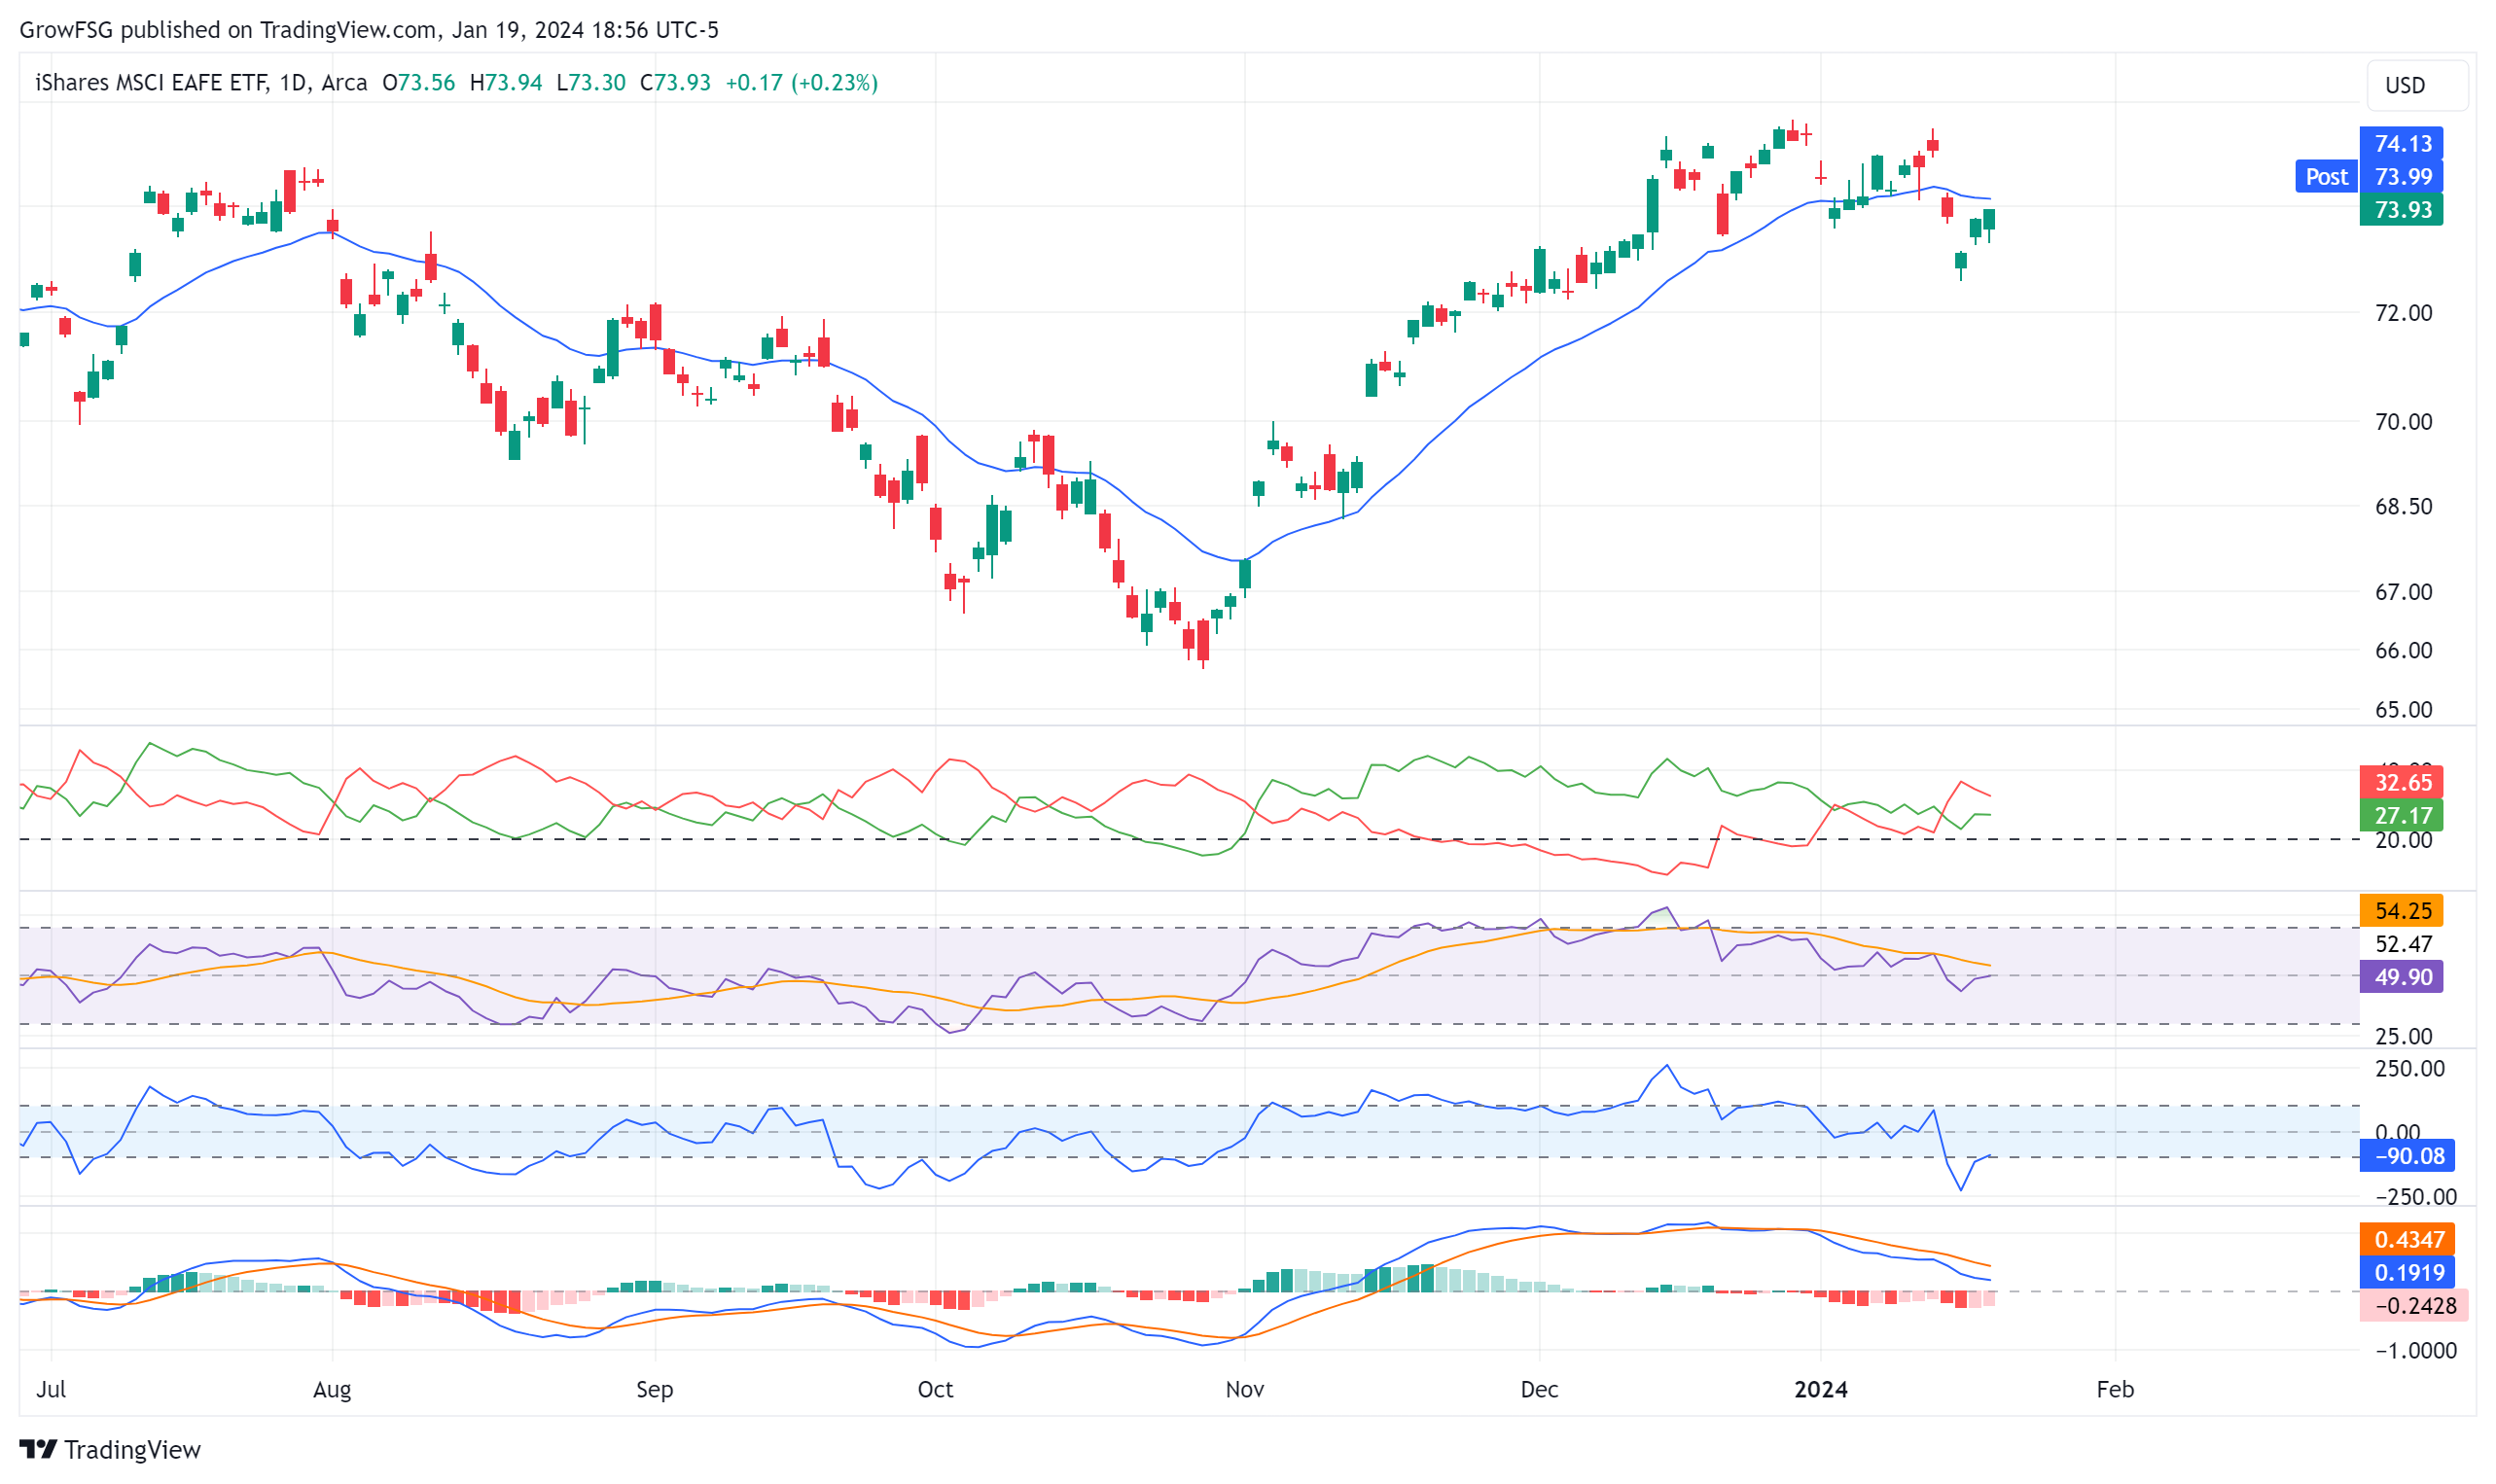
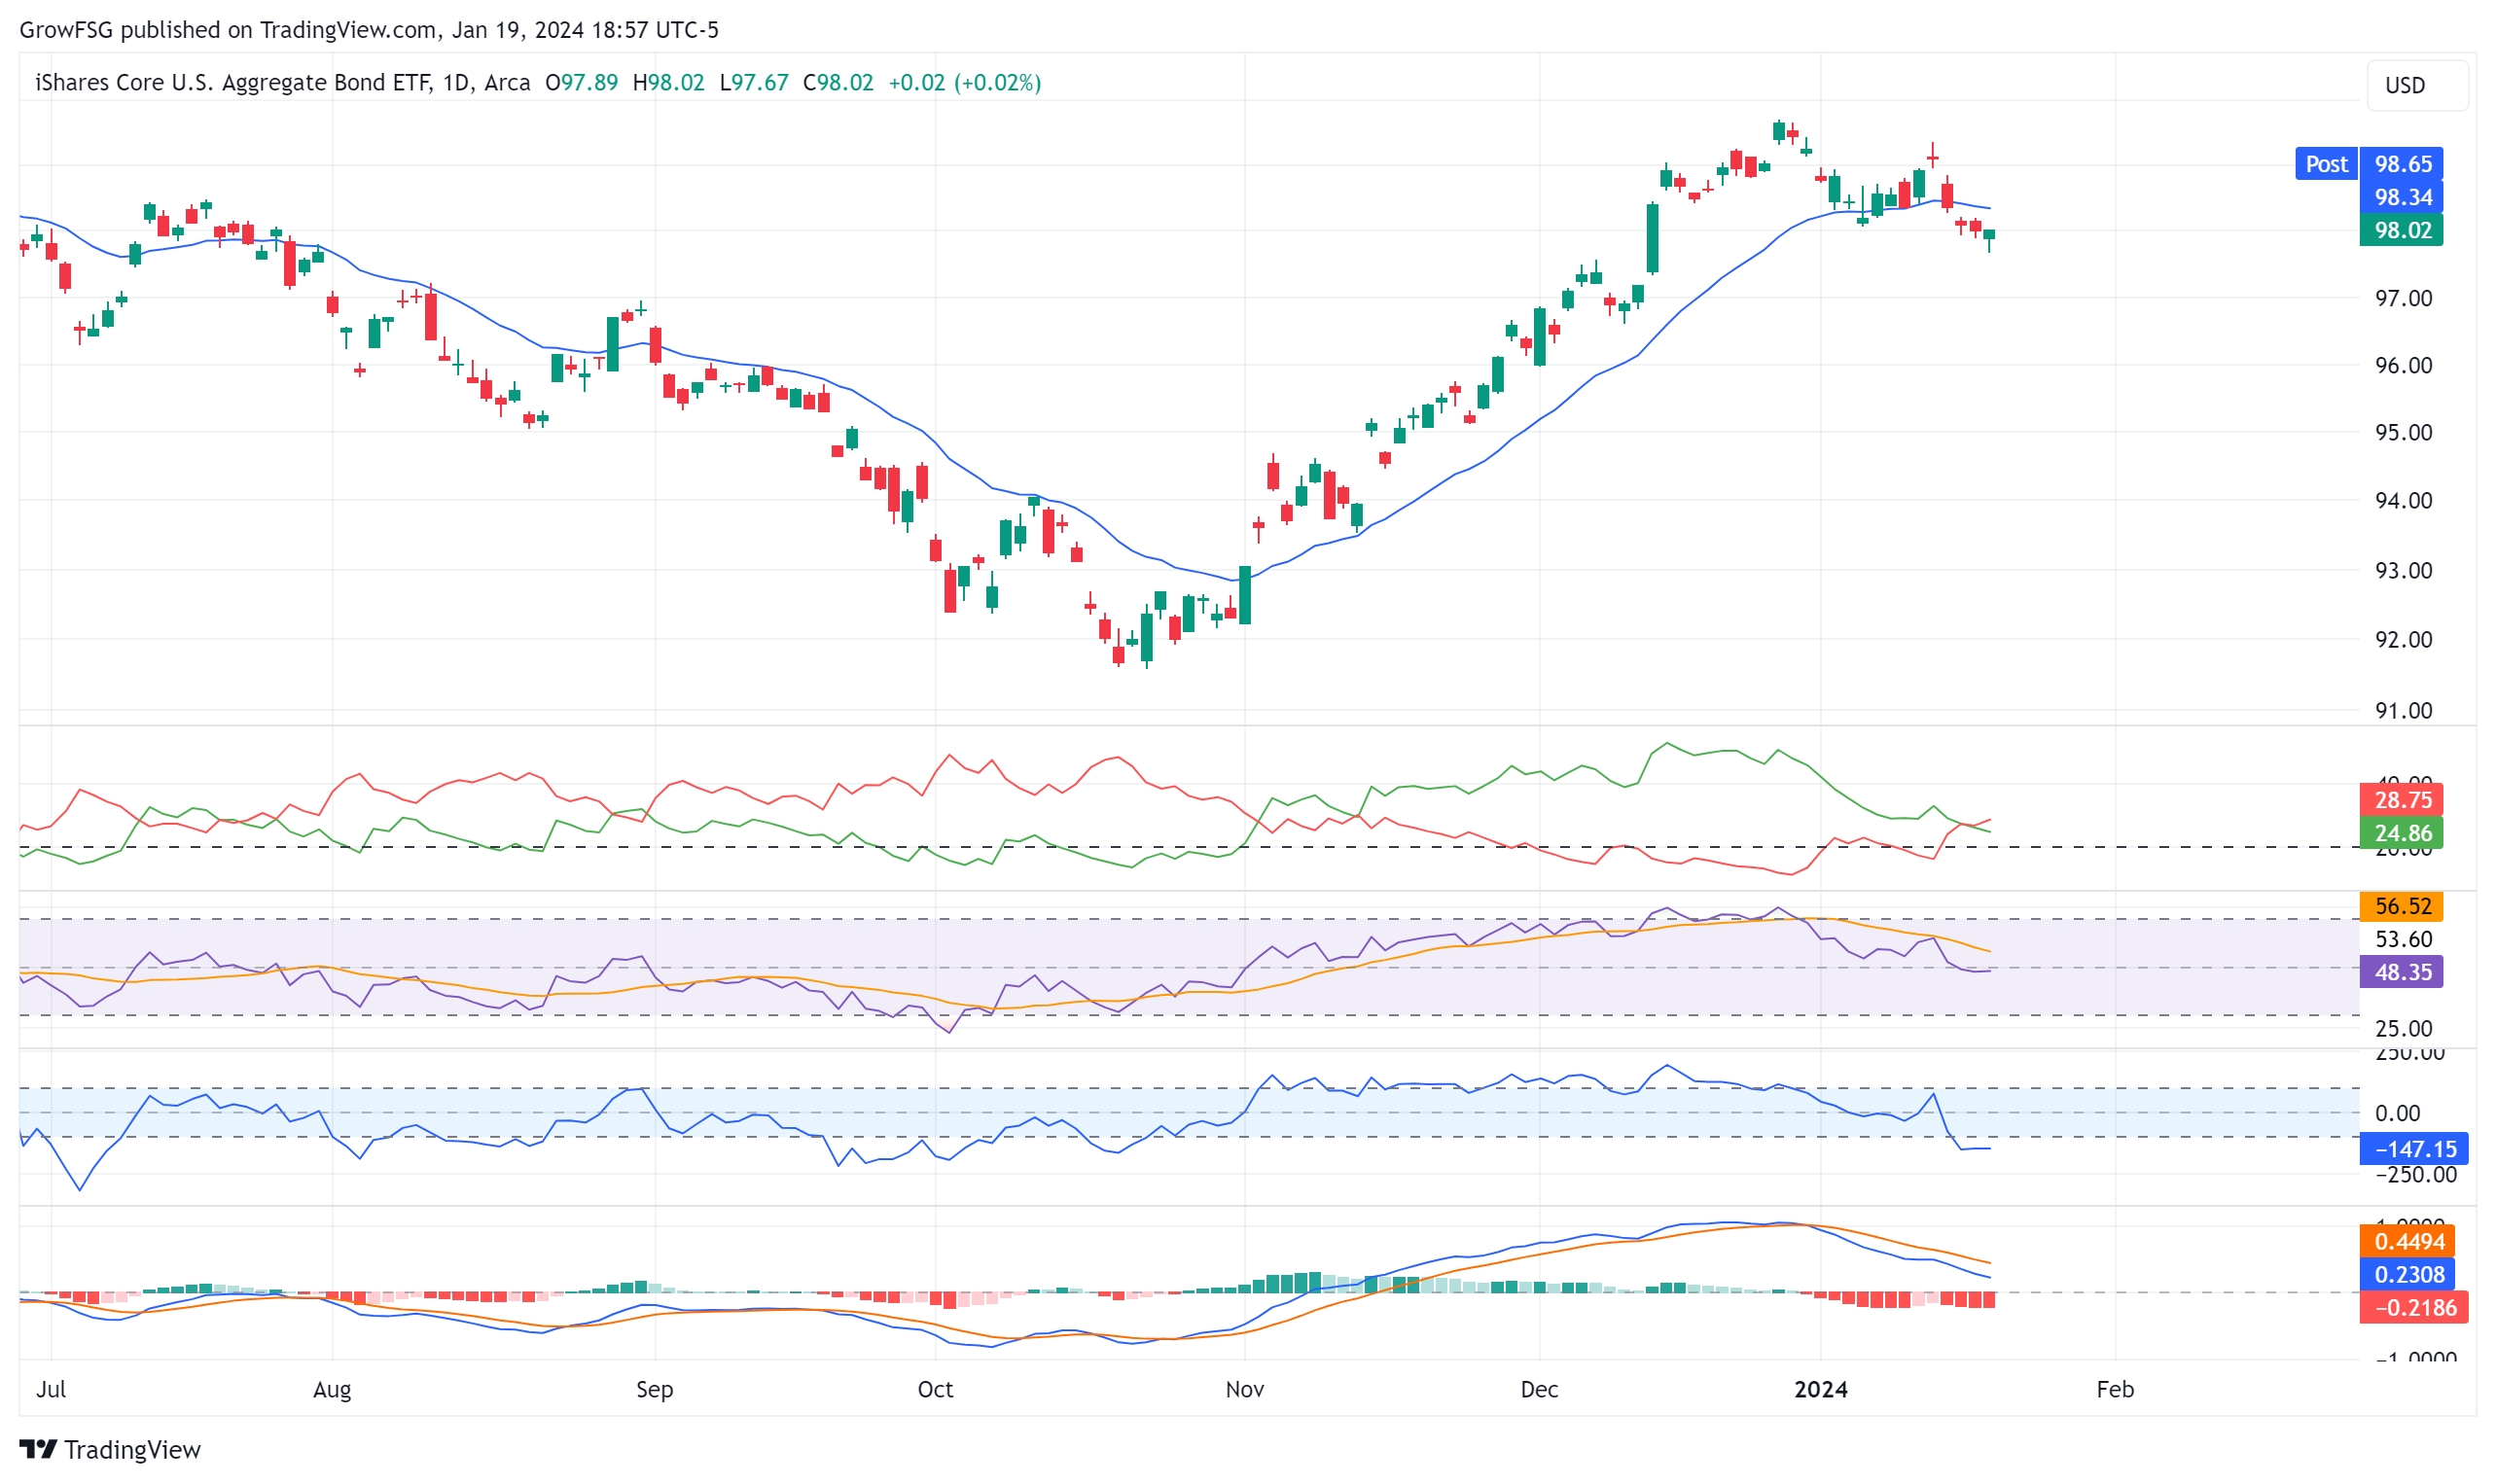
It was a very interesting holiday shortened trading week! The big news is that the S&P500 (C fund) has finally hit new all-time highs. Unfortunately, the S, I and F funds are not going along for the ride. Friday's strong 1.23% price move was DOMINATED by the same sectors that drove the market higher in Q4 of 2023. For the week the C fund finished up 1.17%, S fund up 0.19%, I fund down 1.52% and F fund down 1.09%.
We had a great question in the Members Forum this week; "Is there a fund that has an inverse relationship to the TLT (Long Term Treasury)?". The short answer is yes. The TBT is the inverse of the TLT. In this newsletter, we'll do a deep dive into TLT, TBT, and the real driver of both; TNX - the 10 year treasury yield.
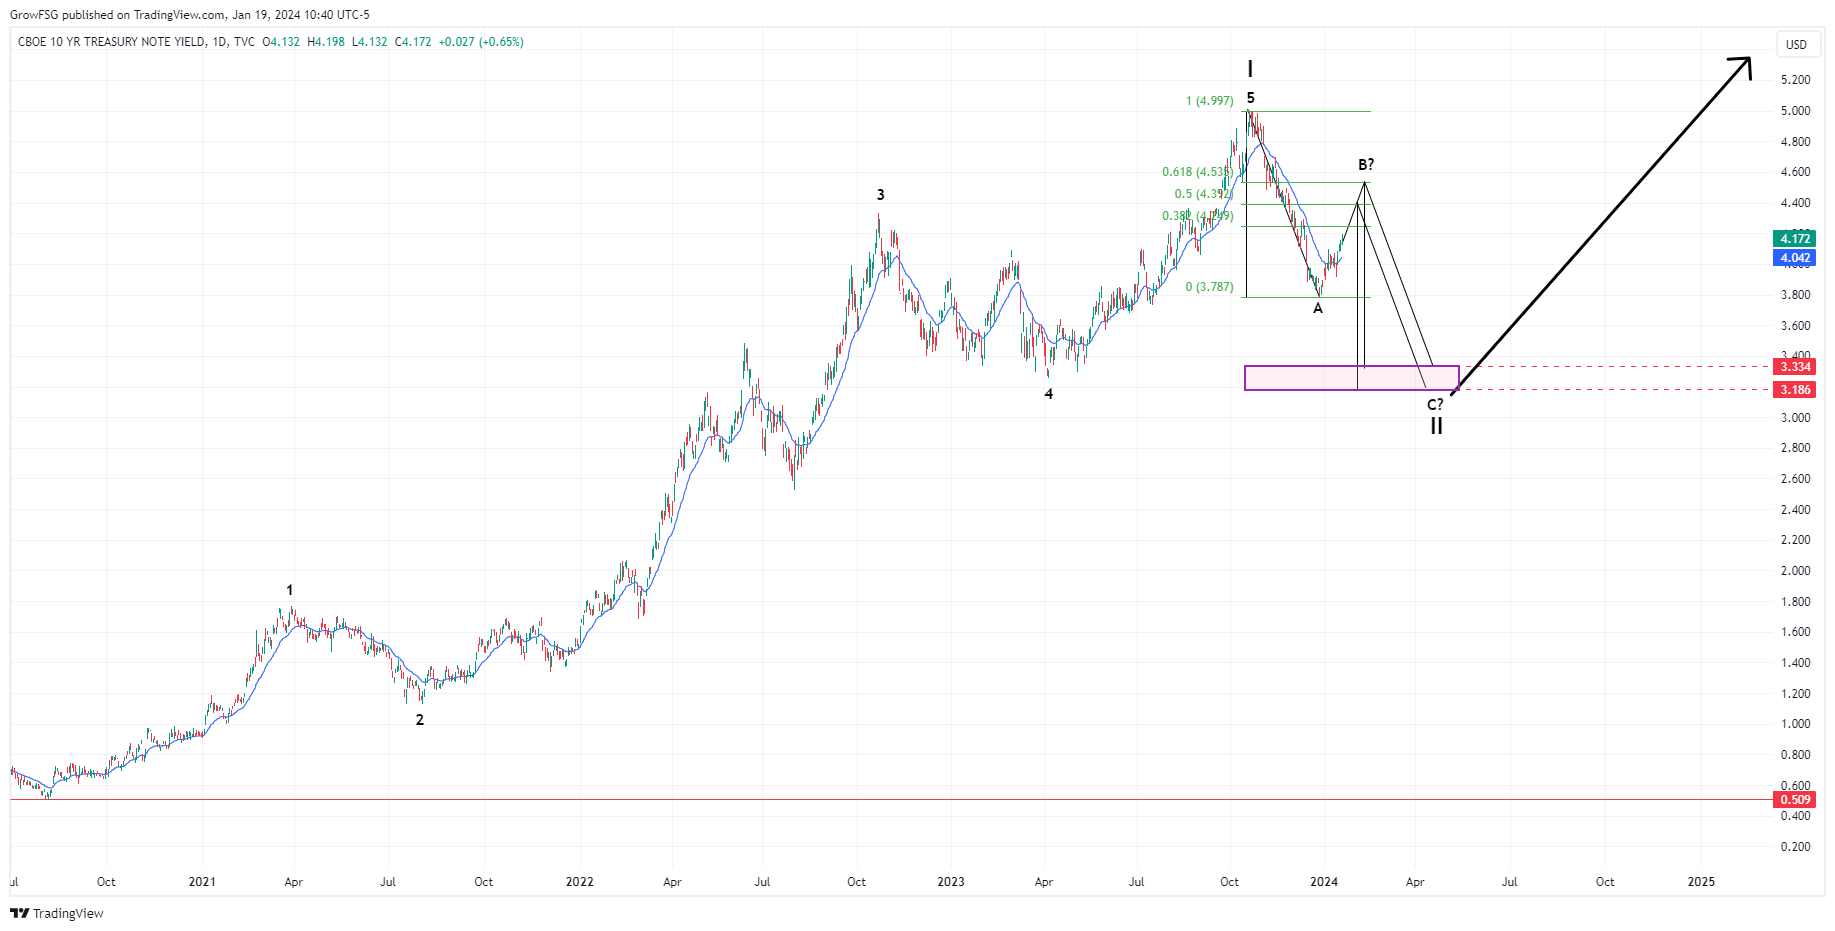
The long term chart of TNX below calls for yield to top relatively soon, followed by another leg down. Elliott wave theory says that wave II should retrace to the prior wave 4, in an A-B-C pattern. If that pattern plays out, the next leg down in yield should hit the rectangle at about 3.2%. This would be the low of wave II. Once this low is in place, wave III should take yield significantly higher over the coming years.
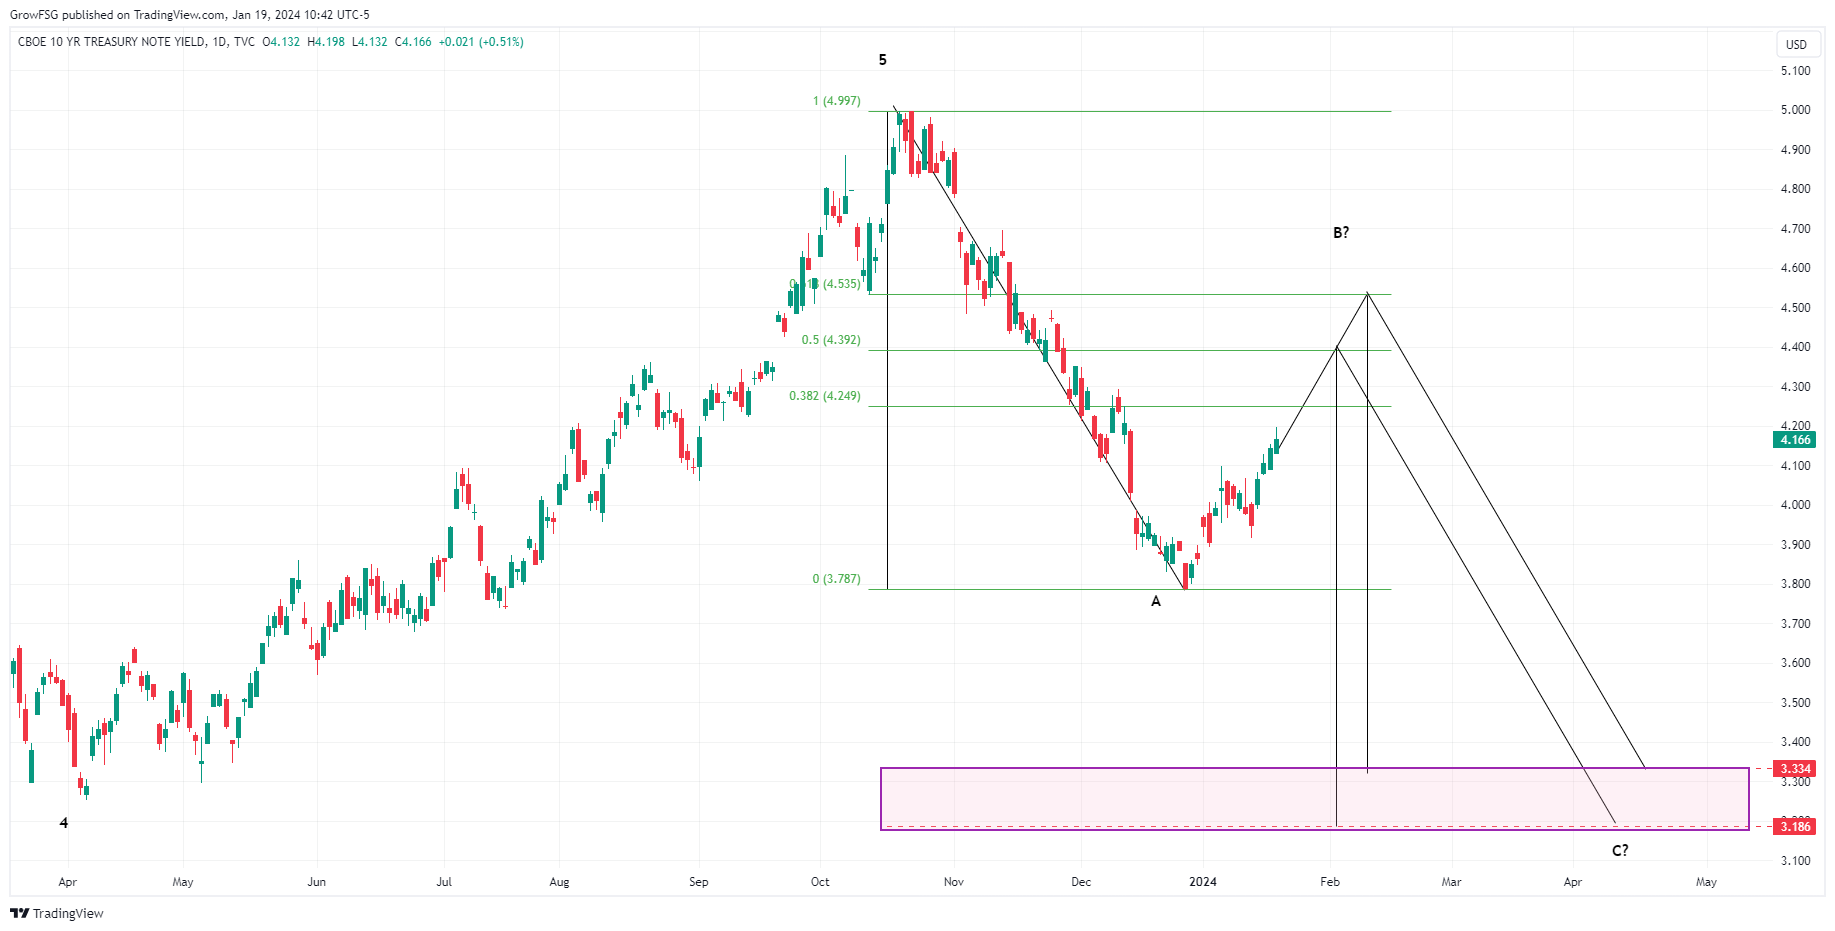
In the short term, yield is approaching the 38% retracement level. The most common retracement levels are 38%, 50%, and 62%. Using the Fibonacci retracement levels and measured moves, we can project the depth of wave II depending on which retracement level ends the current rally in yield. Remember, when yield goes up, stocks are under pressure. When yield goes down, its a tailwind for stocks. Also, when yield goes up, the F fund goes down. When yield goes down, the F fund goes up. Price of bonds (F fund) moves inversely to yield.
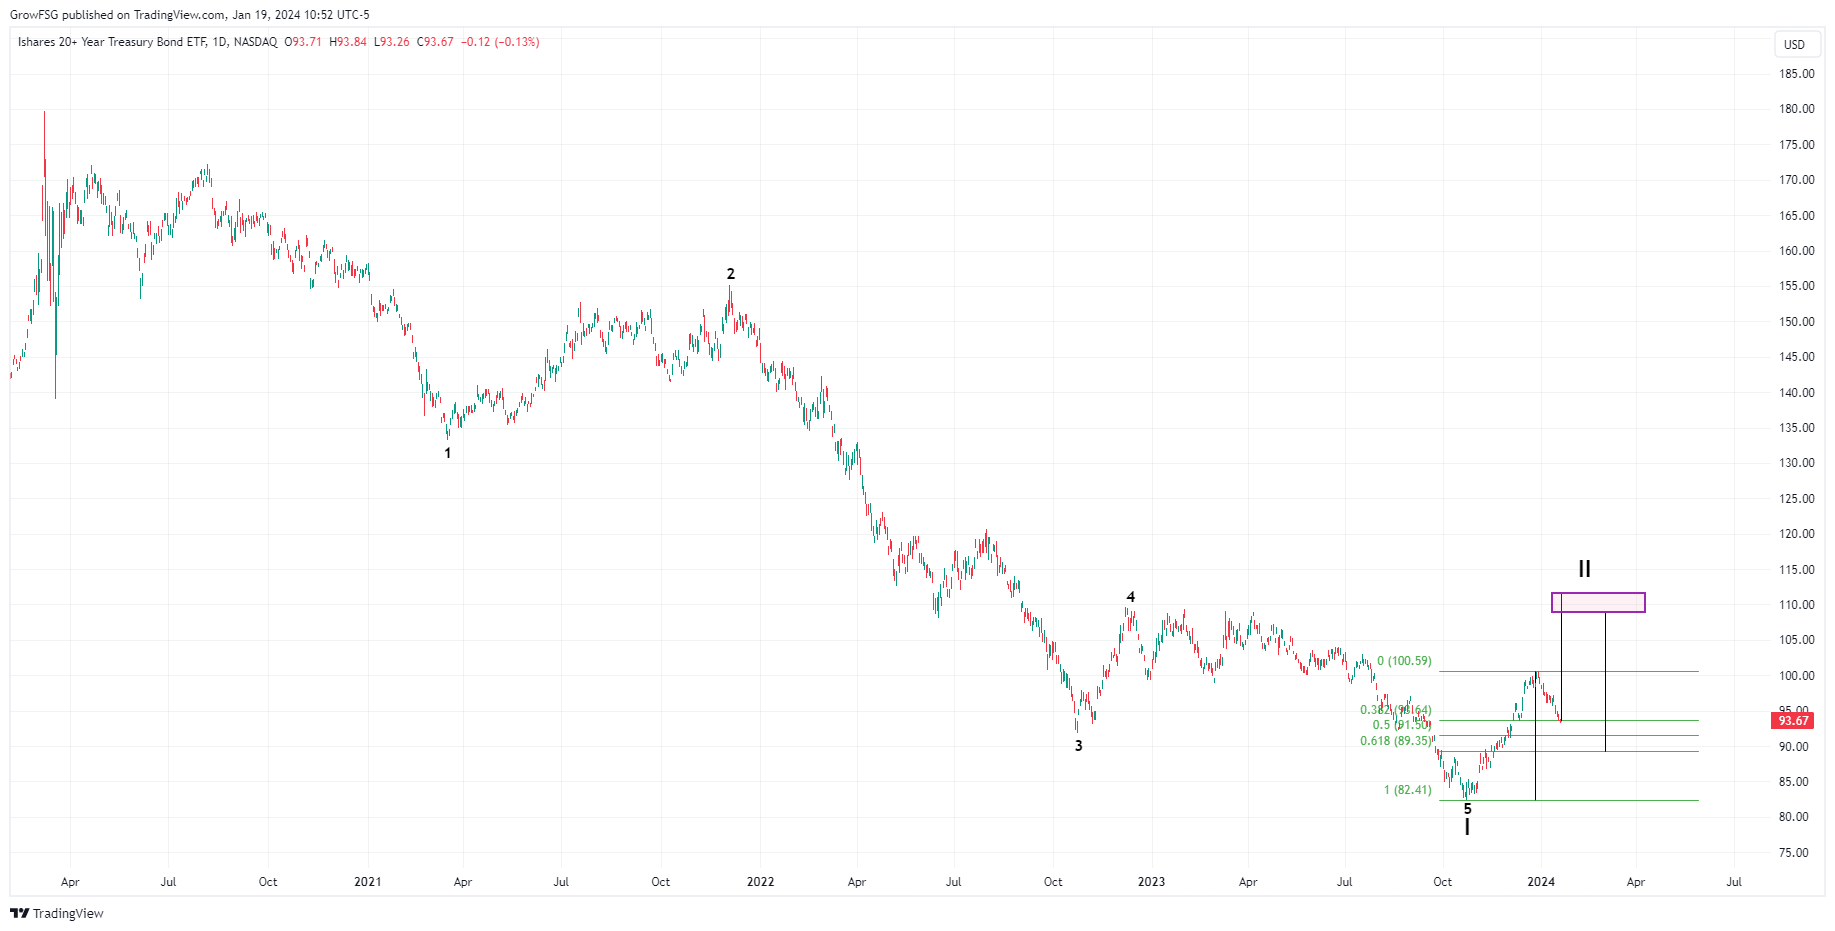
The TLT found support at its 38% retracement level on Friday. IF support holds and the TLT continues to rally, the projection is the high end of the rectangle at 112. That's almost a 19% move higher from Friday's close. However, the break to the upside needs to be confirmed. Once the high of wave II is in place, TLT should fall significantly.

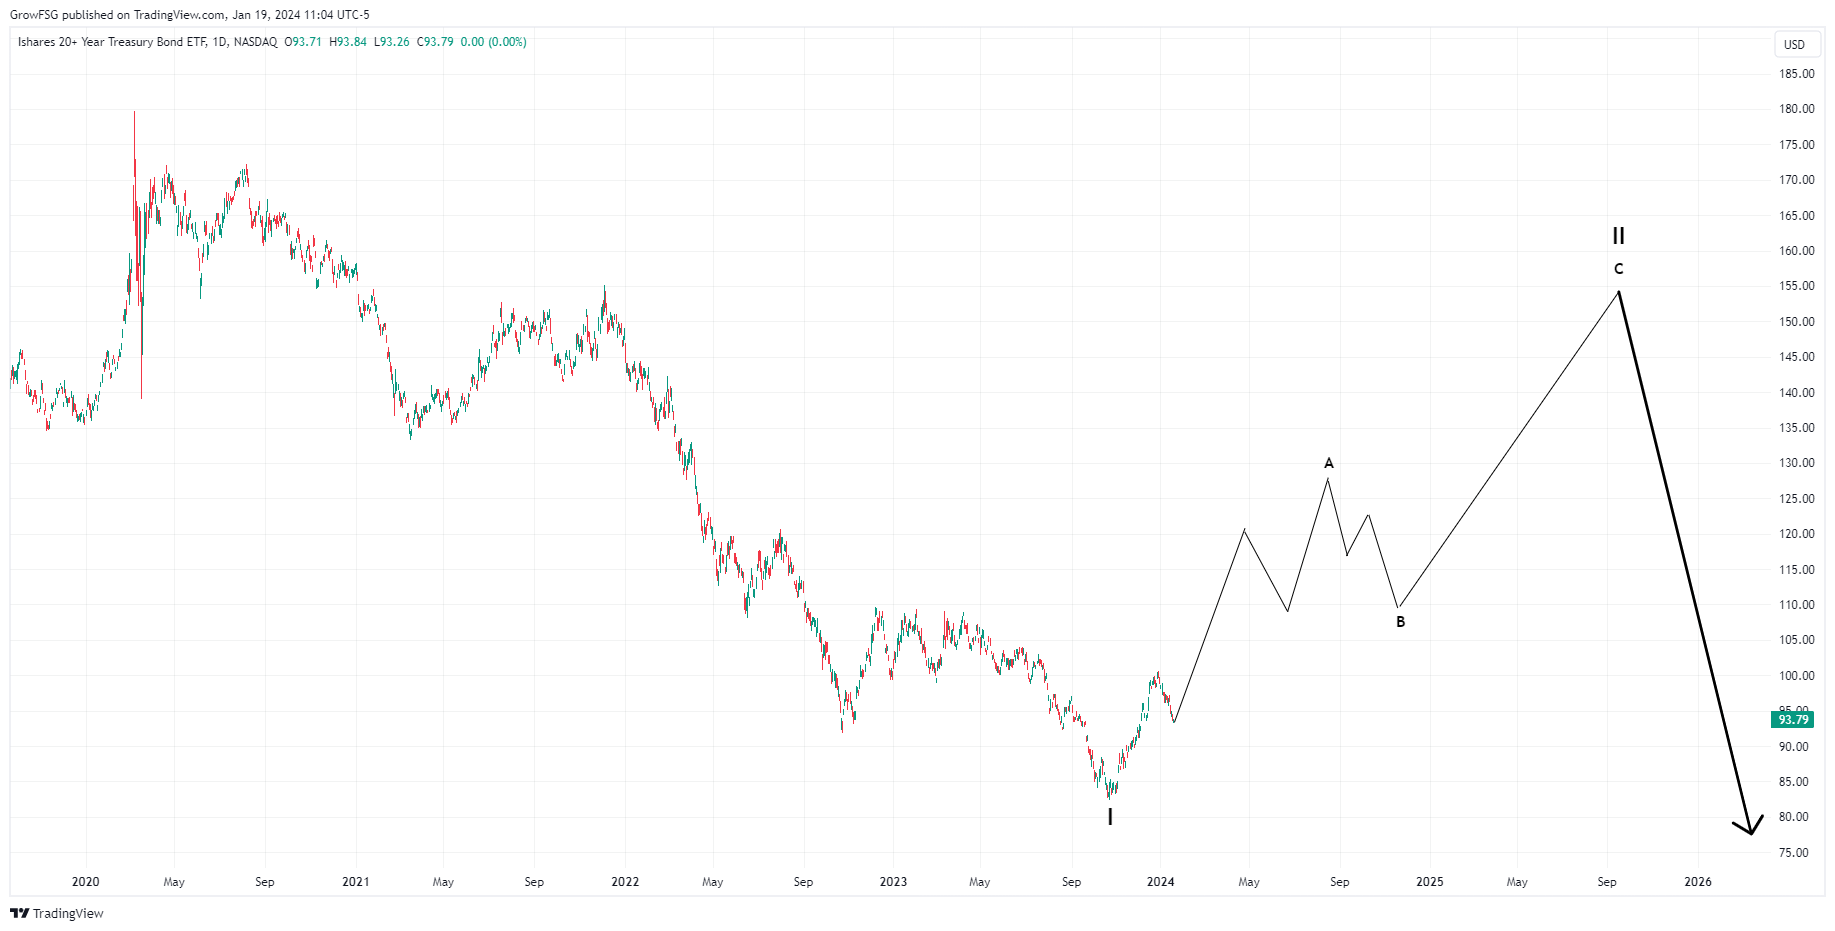
One final thought, and it's an important one! We'll use the TLT chart below to explain. Elliott Wave Theory has RULES and GUIDELINES. All of the analysis above was based on the GUIDELINES. Specifically, wave II corrections tend to play out in an A-B-C pattern and correct back to the previous 4 wave. That is a GUIDELINE. The RULE is that wave II cannot exceed the beginning of wave I. In the case of TLT, wave II could go as high as the August 2020 high (172), but not exceed it. IF that were to play out, wave II could track similar to the chart below. The A-B-C pattern would be a 5-3-5. If TLT blows through the top of the rectangle in the above TLT chart, the pattern in the chart below is likely in play. We definitely need to be open to this as a possibility.
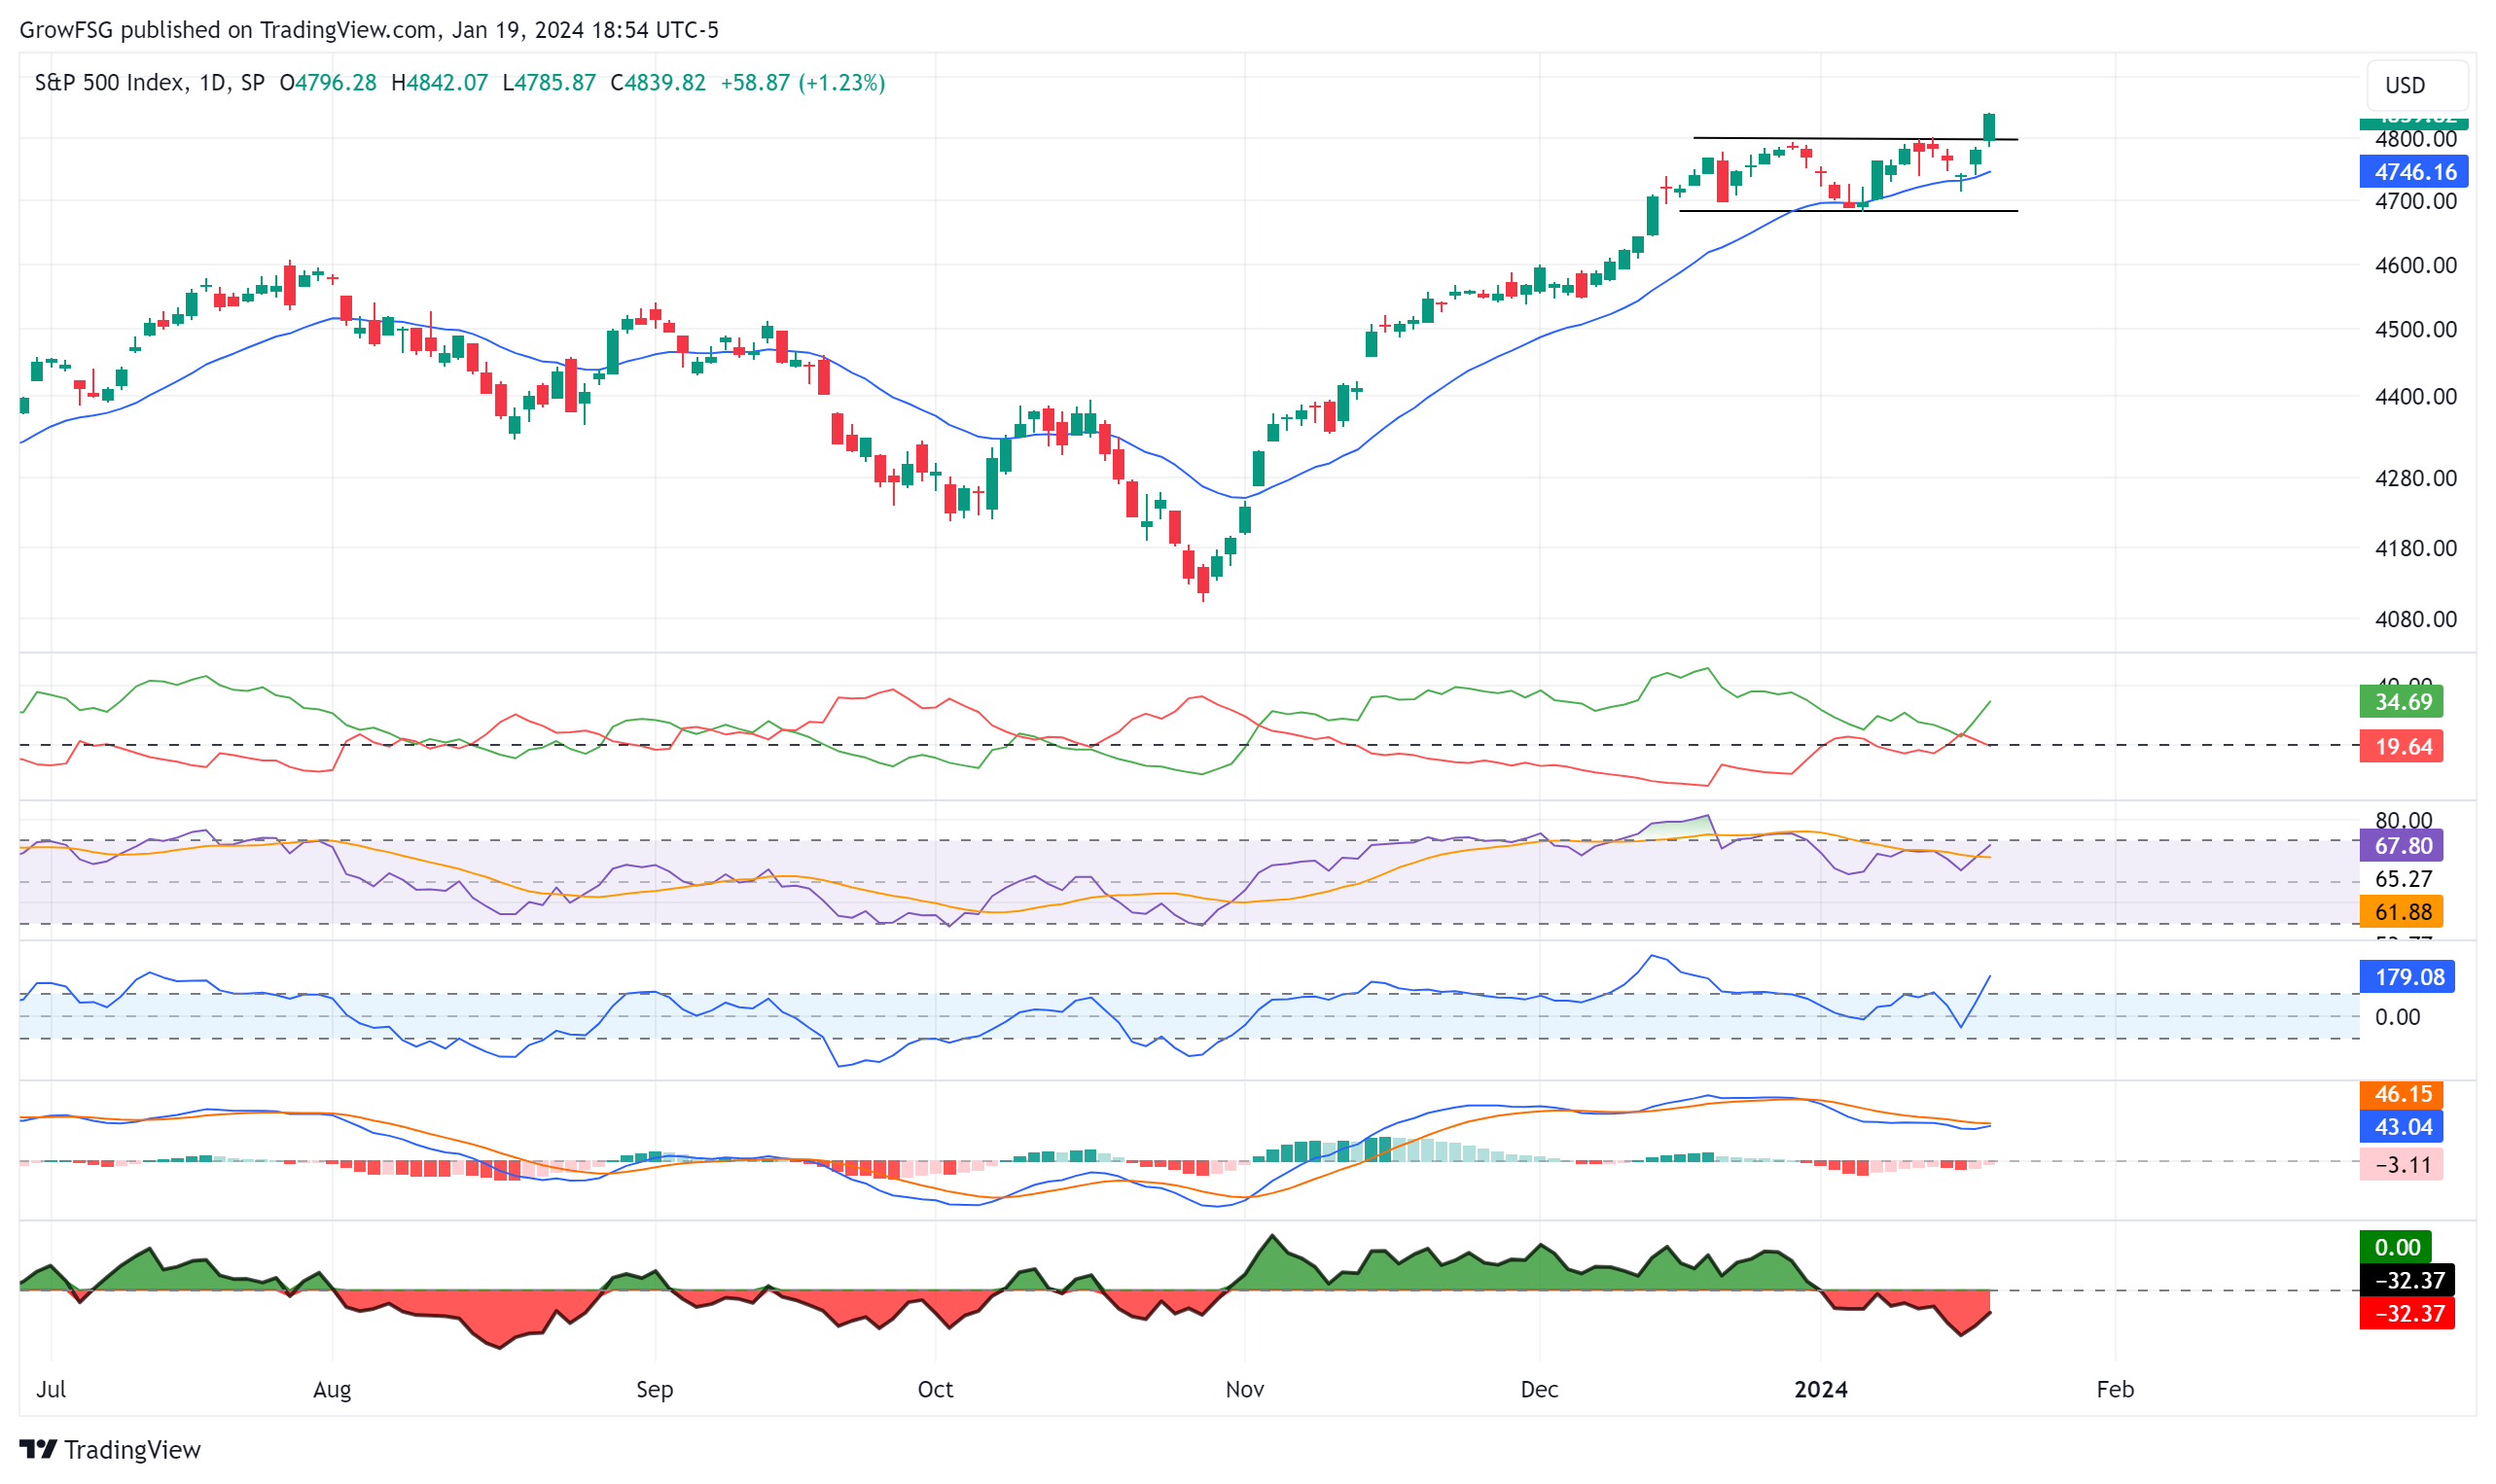
We discuss the "January Effect" in the Podcast this weekend. The January Effect is the seasonal tendency for small cap stocks to outperform large cap stocks from mid-December to early March of the following year. Clearly, the January Effect is failing this year. The C fund is way outperforming the S fund. While the S fund managed to regain its 20DMA on Friday, it is still in a technical down trend with lower highs and lower lows since the late December top. ADX lines are flat, RSI is barely above 50, CCI is below 0, and MACD is still firmly negative. We would not call this a low risk entry point for the S fund. That could change on Monday but, as of Friday's close, buying the S fund here is significantly more risky than the C fund.
The I fund is in worse shape than the S fund. It is also in a down trend with lower highs and lower lows since the December high. It's below its 20DMA, RSI just below 50, CCI well below 0, and MACD negative. ADX shows the trend of buyers leaving and sellers coming in since mid-December.
The F fund is the worst chart of the lot. Price is in a down trend and the technical indicators are all declining. What's very important to observe is that the C fund and the F fund had been moving up and down in lock-step since the October 2023 bottom. This divergence, C fund moving higher and F fund moving lower, is telling us that there is a shift going on in the market. The F fund is moving down because yields are moving up; that's the math. What's strange is that higher bond yields tend to push stocks lower, not higher. We need to keep an eye on this divergence!
We talk about Tom Lee @Fundstrat on Twitter in the Podcast this weekend. He's known on Wall Street as a "Perma-Bull". His interview on CNBC this week is well worth checking out. On January 16th he called for a slight new high and then a 7% correction. He's bullish on 2024 but thinks the gains will be made in the second half of the year.
It's a very challenging market! We will continue to call it as we see it...
Have a great weekend!
The Grow My TSP Team
We had a great question in the Members Forum this week; "Is there a fund that has an inverse relationship to the TLT (Long Term Treasury)?". The short answer is yes. The TBT is the inverse of the TLT. In this newsletter, we'll do a deep dive into TLT, TBT, and the real driver of both; TNX - the 10 year treasury yield.
10 Year Treasury Yield - TNX
The 10 year treasury yield, ticker symbol TNX, is one of the best yields we can track. The FED controls the 2 year and shorter yield curve but the bond market controls the longer end of the yield curve. The TNX ended a 40 year decline in August of 2020. Since then, yield has been rising with a peak in October 2023 at 5%. We track the TNX for lots of reasons, specifically, a rising yield is a headwind for stocks, especially small caps (our S fund). Since bottoming in August 2020, the TNX progressed in a text book Elliott Wave pattern to its 5% peak. From October through December 2023, yield fell dramatically. This was a huge tailwind for stocks to rally over that period. Since bottoming in late December, yield has been rising. This has put pressure on the market which is most readily seen in the performance of the S fund since the beginning of the year. The question is, can we project what is likely to happen with yield going forward? Elliott Waves, Fibonacci retracements, and measured moves can be a useful guide.The long term chart of TNX below calls for yield to top relatively soon, followed by another leg down. Elliott wave theory says that wave II should retrace to the prior wave 4, in an A-B-C pattern. If that pattern plays out, the next leg down in yield should hit the rectangle at about 3.2%. This would be the low of wave II. Once this low is in place, wave III should take yield significantly higher over the coming years.
In the short term, yield is approaching the 38% retracement level. The most common retracement levels are 38%, 50%, and 62%. Using the Fibonacci retracement levels and measured moves, we can project the depth of wave II depending on which retracement level ends the current rally in yield. Remember, when yield goes up, stocks are under pressure. When yield goes down, its a tailwind for stocks. Also, when yield goes up, the F fund goes down. When yield goes down, the F fund goes up. Price of bonds (F fund) moves inversely to yield.
TLT - Long Term Treasury Bond
The TLT (VLGSX in the Mutual Fund Window) tracks the 20 year treasury bond. Remember, the price of bonds moves inverse to yield. While yield hit an historic low in 2020, the TLT hit an historic high. Since then, it has been moving lower in the same 5 wave Elliott Wave pattern. The long term chart of the TLT calls for a second leg higher to complete wave II, then the beginning of wave III to the downside. The F fund would have a very similar projection.The TLT found support at its 38% retracement level on Friday. IF support holds and the TLT continues to rally, the projection is the high end of the rectangle at 112. That's almost a 19% move higher from Friday's close. However, the break to the upside needs to be confirmed. Once the high of wave II is in place, TLT should fall significantly.
TBT - Inverse TLT
TBT is the inverse of the TLT. It is a derivative fund, meaning it does not track a yield directly. As a result, the price movement and chart are not exactly inverse to the TLT. The TBT chart is similar to the TNX chart but, because it follows the 20 year treasury yield, the price swings can be more significant than the TNX. The TBT has more upside before hitting a Fibonacci retracement level but not enough upside, in our opinion, to be worth buying the TBT and trying to get those gains. Once the TBT rolls over, it has a long way down to complete wave II at the rectangle. Once wave II is complete, TBT will be a long-term buy and hold in wave III.One final thought, and it's an important one! We'll use the TLT chart below to explain. Elliott Wave Theory has RULES and GUIDELINES. All of the analysis above was based on the GUIDELINES. Specifically, wave II corrections tend to play out in an A-B-C pattern and correct back to the previous 4 wave. That is a GUIDELINE. The RULE is that wave II cannot exceed the beginning of wave I. In the case of TLT, wave II could go as high as the August 2020 high (172), but not exceed it. IF that were to play out, wave II could track similar to the chart below. The A-B-C pattern would be a 5-3-5. If TLT blows through the top of the rectangle in the above TLT chart, the pattern in the chart below is likely in play. We definitely need to be open to this as a possibility.
TSP Fund Charts
The C fund broke out of its month lone sideways consolidation pattern on Friday; no doubt about it! Price found support at the 20MDA line on Wednesday of this week and rallied into week's end. What's frustrating is that RSI and CCI never got oversold. That tells us that the overbought conditions generated during the rally since the October 2023 low have not been resolved. With the green ADX line turning up and the red ADX line below 20, this is a low risk entry point to the C fund in the short term. How long a rally in the C fund can continue is very suspect but, it has not paid to bet against the C fund since October 2022. We will closely analyze all the fund charts over the weekend but, a change to the Grow Model Portfolio on Monday is a possibility.We discuss the "January Effect" in the Podcast this weekend. The January Effect is the seasonal tendency for small cap stocks to outperform large cap stocks from mid-December to early March of the following year. Clearly, the January Effect is failing this year. The C fund is way outperforming the S fund. While the S fund managed to regain its 20DMA on Friday, it is still in a technical down trend with lower highs and lower lows since the late December top. ADX lines are flat, RSI is barely above 50, CCI is below 0, and MACD is still firmly negative. We would not call this a low risk entry point for the S fund. That could change on Monday but, as of Friday's close, buying the S fund here is significantly more risky than the C fund.
The I fund is in worse shape than the S fund. It is also in a down trend with lower highs and lower lows since the December high. It's below its 20DMA, RSI just below 50, CCI well below 0, and MACD negative. ADX shows the trend of buyers leaving and sellers coming in since mid-December.
The F fund is the worst chart of the lot. Price is in a down trend and the technical indicators are all declining. What's very important to observe is that the C fund and the F fund had been moving up and down in lock-step since the October 2023 bottom. This divergence, C fund moving higher and F fund moving lower, is telling us that there is a shift going on in the market. The F fund is moving down because yields are moving up; that's the math. What's strange is that higher bond yields tend to push stocks lower, not higher. We need to keep an eye on this divergence!
Bottom Line
New All Time Highs! FOMO (Fear Of Missing Out) is back, almost to extremes. The CNN Fear & Greed Index moved from 66 to 72 in one day! This will be the focus for the vast majority of TSP investors this weekend. If price continues higher next week, which is very likely, the S&P will once again be extremely overbought and due for correction. Do you want to buy into the C fund under those conditions versus the guaranteed safety of the G fund? That question has to be answered based on your personal circumstances and risk tolerance.We talk about Tom Lee @Fundstrat on Twitter in the Podcast this weekend. He's known on Wall Street as a "Perma-Bull". His interview on CNBC this week is well worth checking out. On January 16th he called for a slight new high and then a 7% correction. He's bullish on 2024 but thinks the gains will be made in the second half of the year.
It's a very challenging market! We will continue to call it as we see it...
Have a great weekend!
The Grow My TSP Team
RELATED READS

Copyright Grow Investments, LLC | GrowMyTSP.com
Thrift Savings Plan Disclaimer
Neither growmytsp.com nor any of its partners or representatives is in any way affiliated with the United States Government, The Federal Retirement Thrift Investment Board (FRTIB.gov) or the Thrift Savings Plan (TSP.gov), and any service being offered is not sanctioned by the United States Government, the Federal Retirement Thrift Investment Board or the Thrift Savings Plan.