
TSP Weekly Newsletter
TSP Weekly Newsletter
December 3, 2023
It was a great way to begin December with green across the screen this week! The C fund advanced 0.77%, S fund up 3.59%, I fund up 0.85%, and the F fund up 2.06%. While the market has been in absolute rally mode for the past 5 weeks, now is not a time to get complacent. All 4 TSP funds are overbought in the short term. The seasonal trend is for a pull back in the first half of December. Short term risk is high but, that does not mean that prices cannot continue higher. The more consequential question is the long term direction of the dollar and yield.
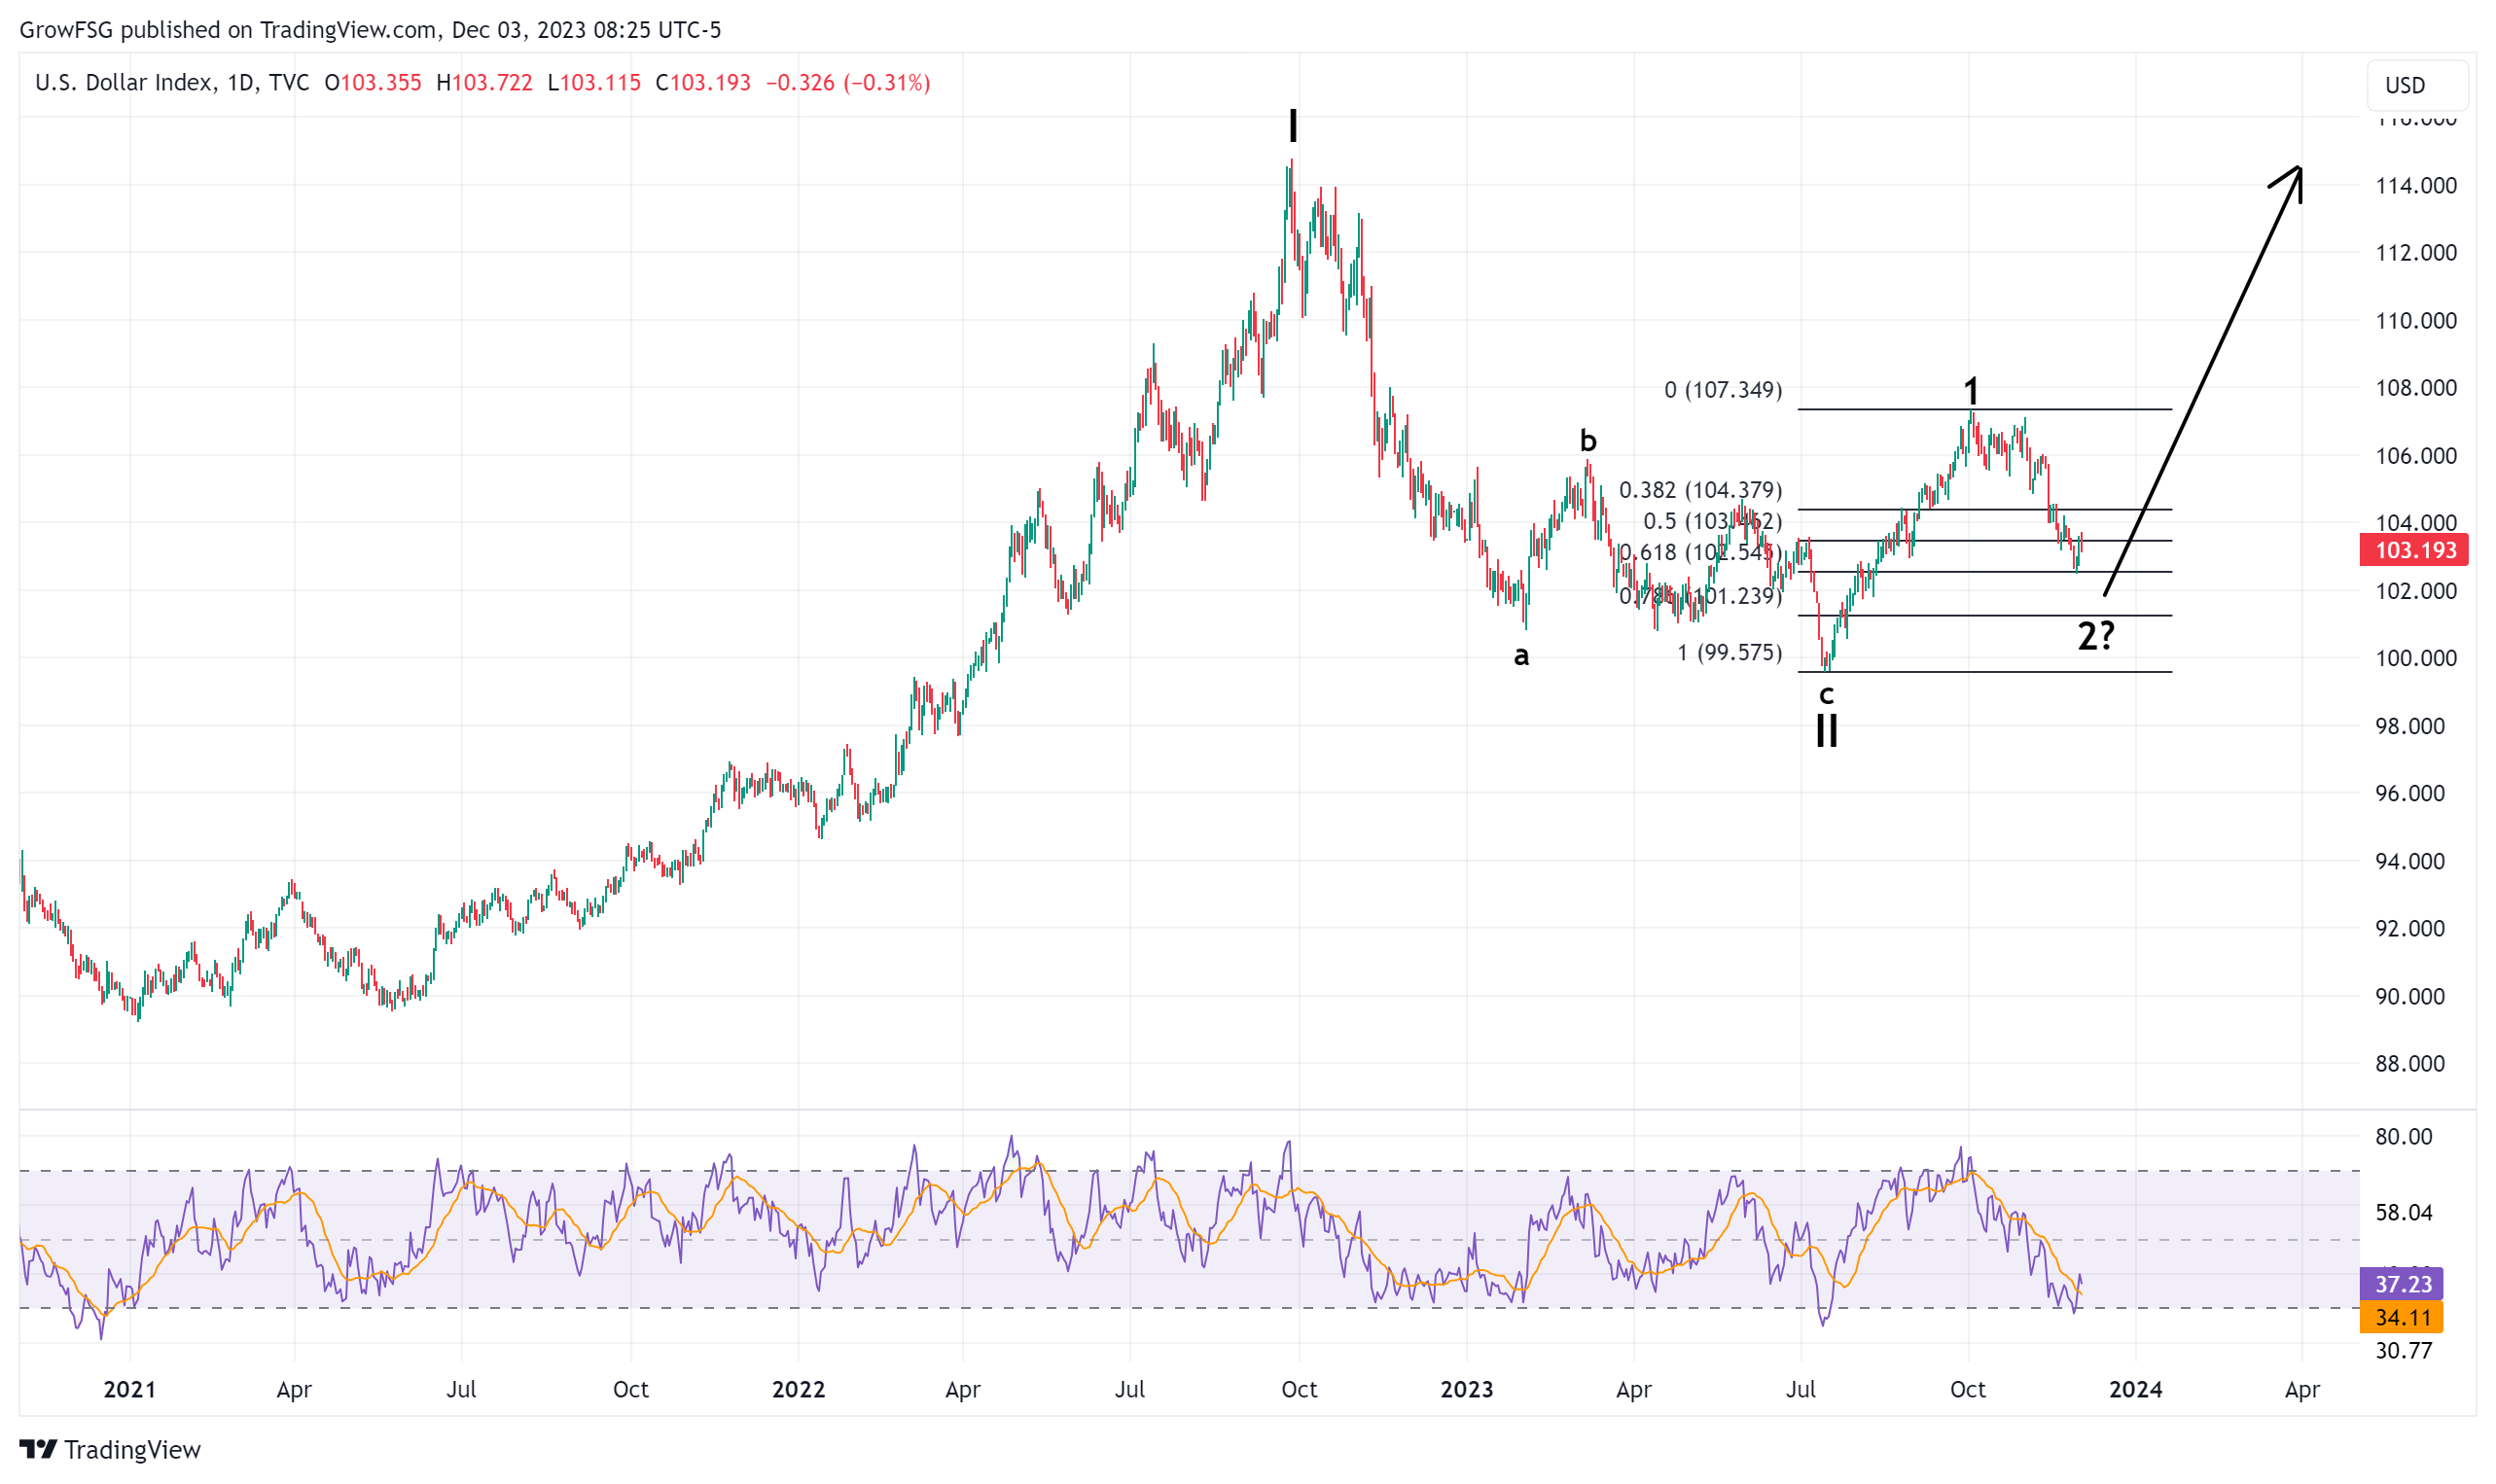
In the short term, wave 2 has hit the 0.618% retracement level of wave 1. It could continue down to the 0.786% level but cannot undercut wave II. A declining dollar is a tailwind for stocks. If the dollar continues to fall in the short term, stocks will continue to rally. Once the completion of wave 2 is confirmed, a rising dollar will be one of a number of headwinds for stocks.
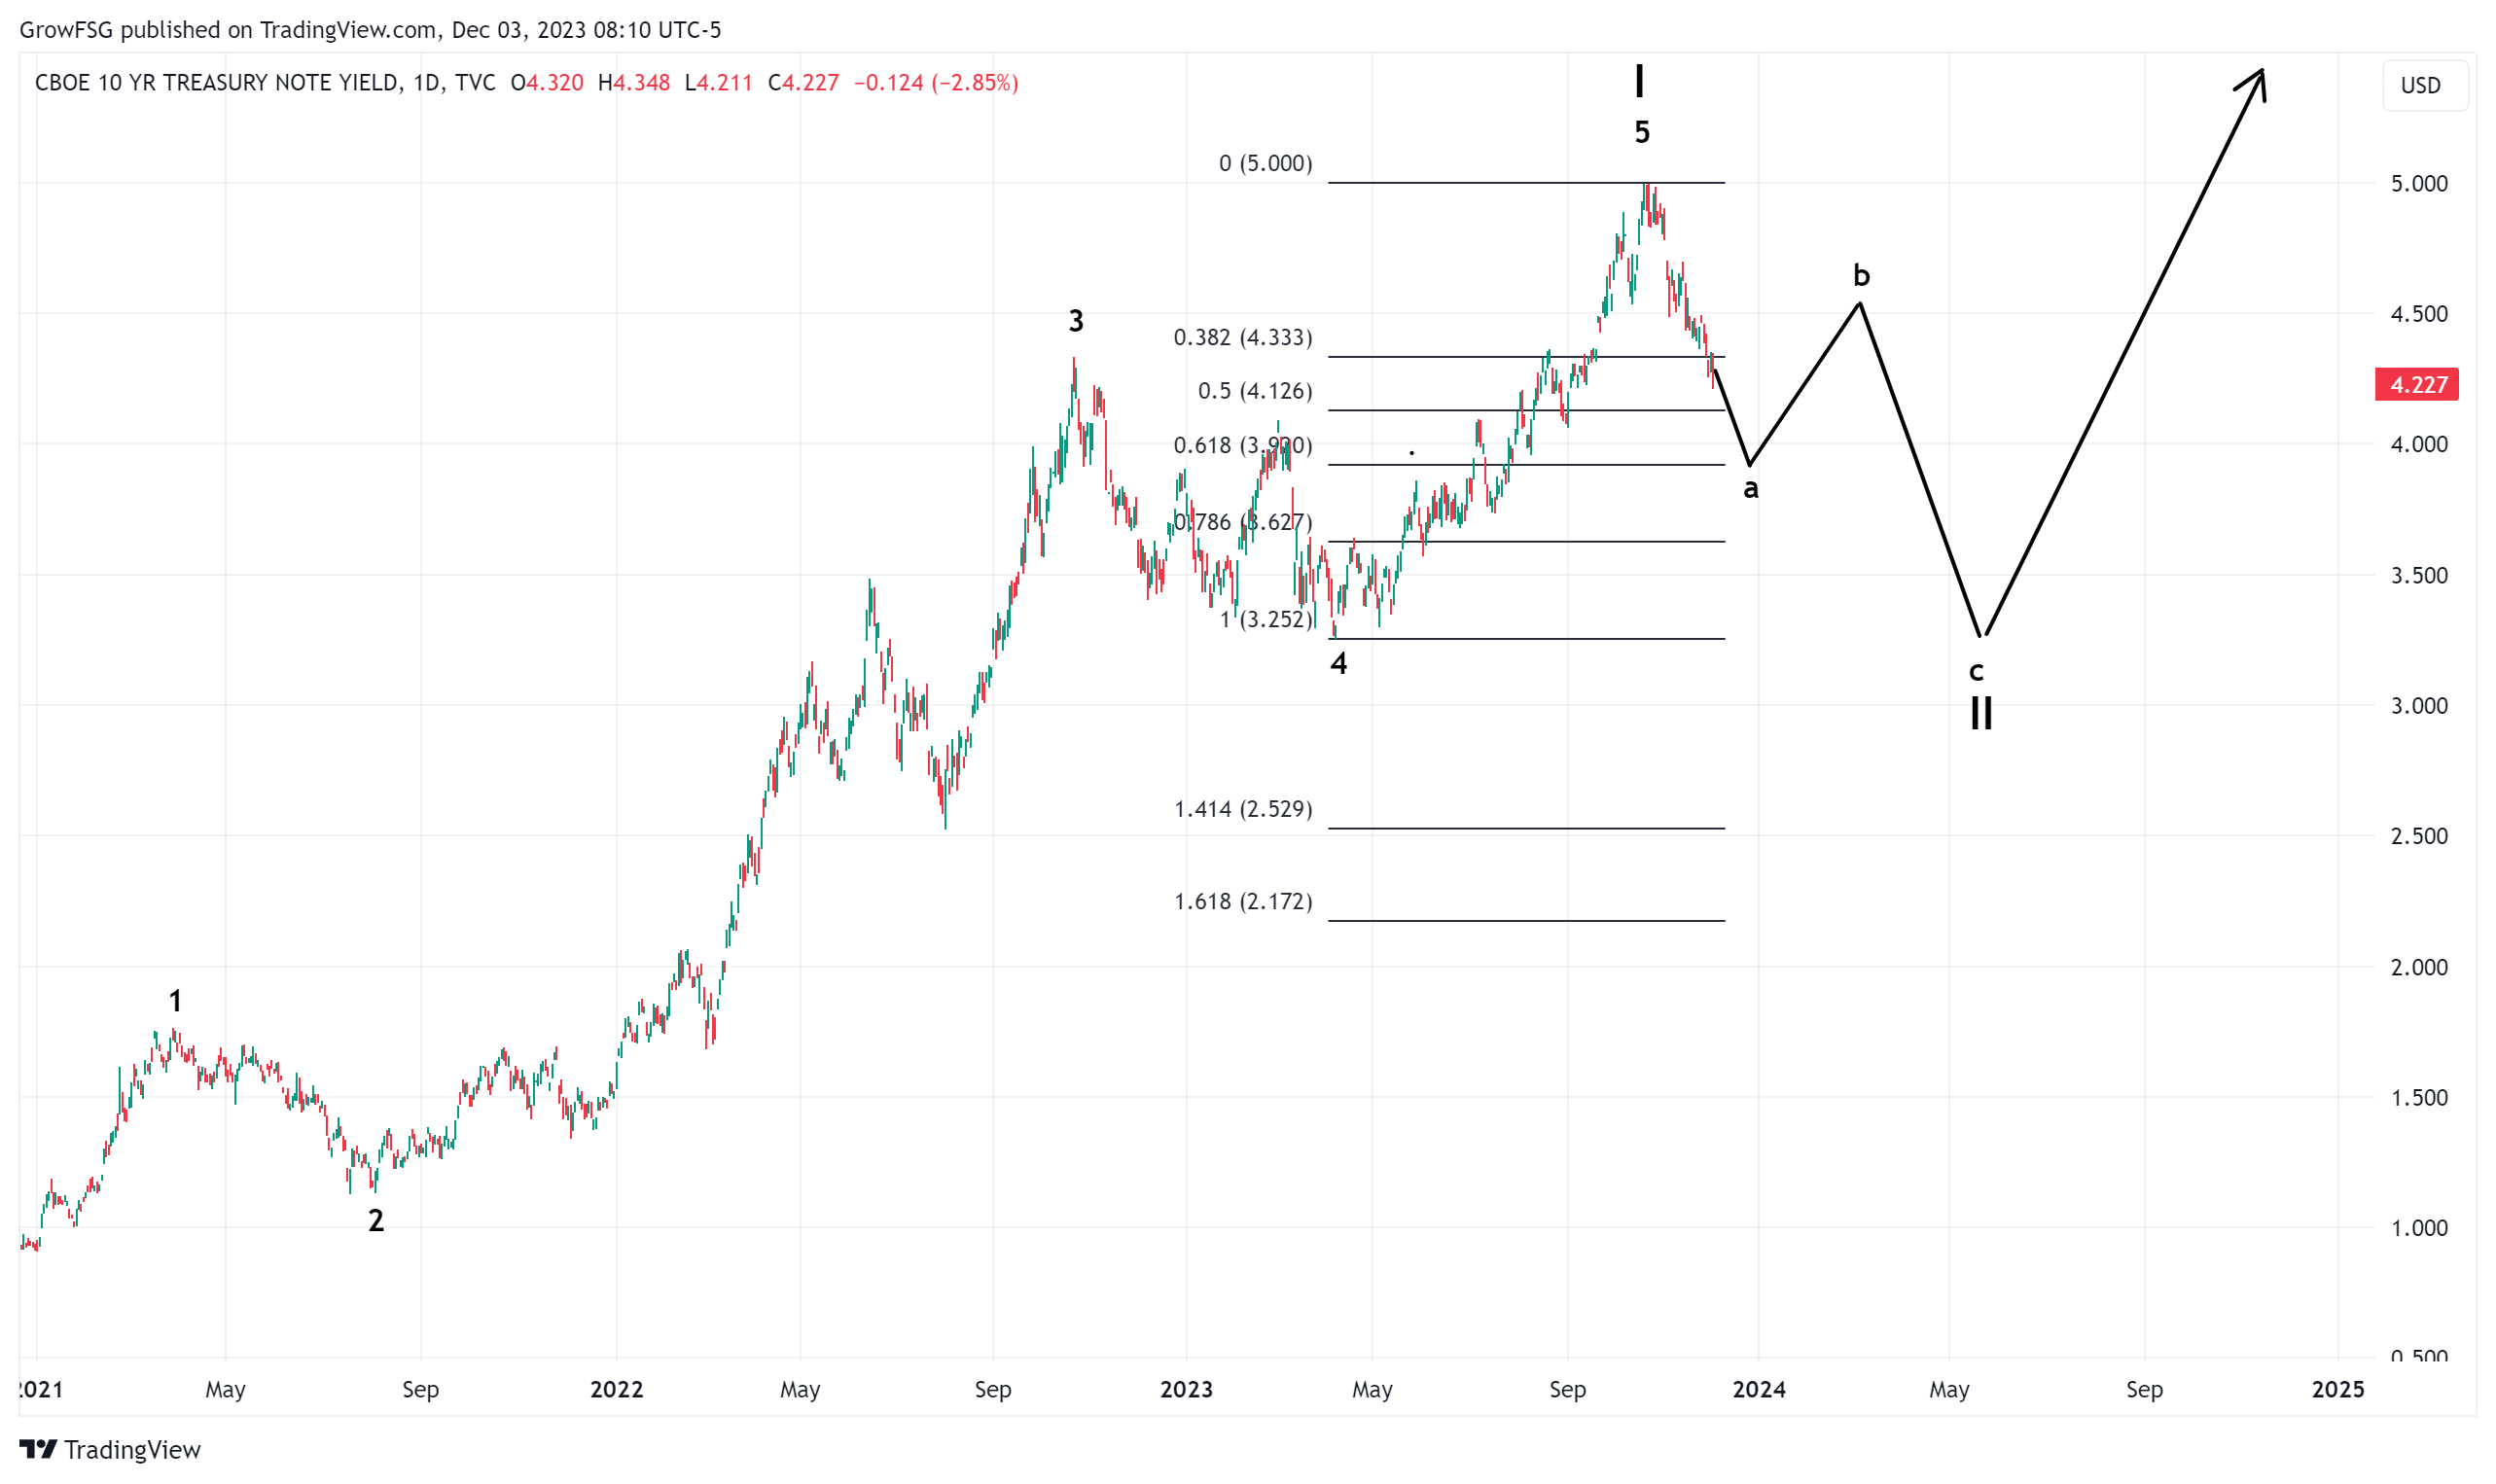
The direction of yield is important but the WHY it moves in that direction is much more important. If yield continues to decline in an orderly a-b-c correction, with no major economic event, then stocks will continue to rally. If yield falls due to a flight to safety from a significant economic event, stocks will fall. The WHY yield falls is very important!
Conversely, if yield bottoms at wave a and begins to move higher, we would likely see a shallow pull back in stocks. A spike in yield, due to a massive rise in inflation, could cause stocks to collapse; again, the WHY matters!
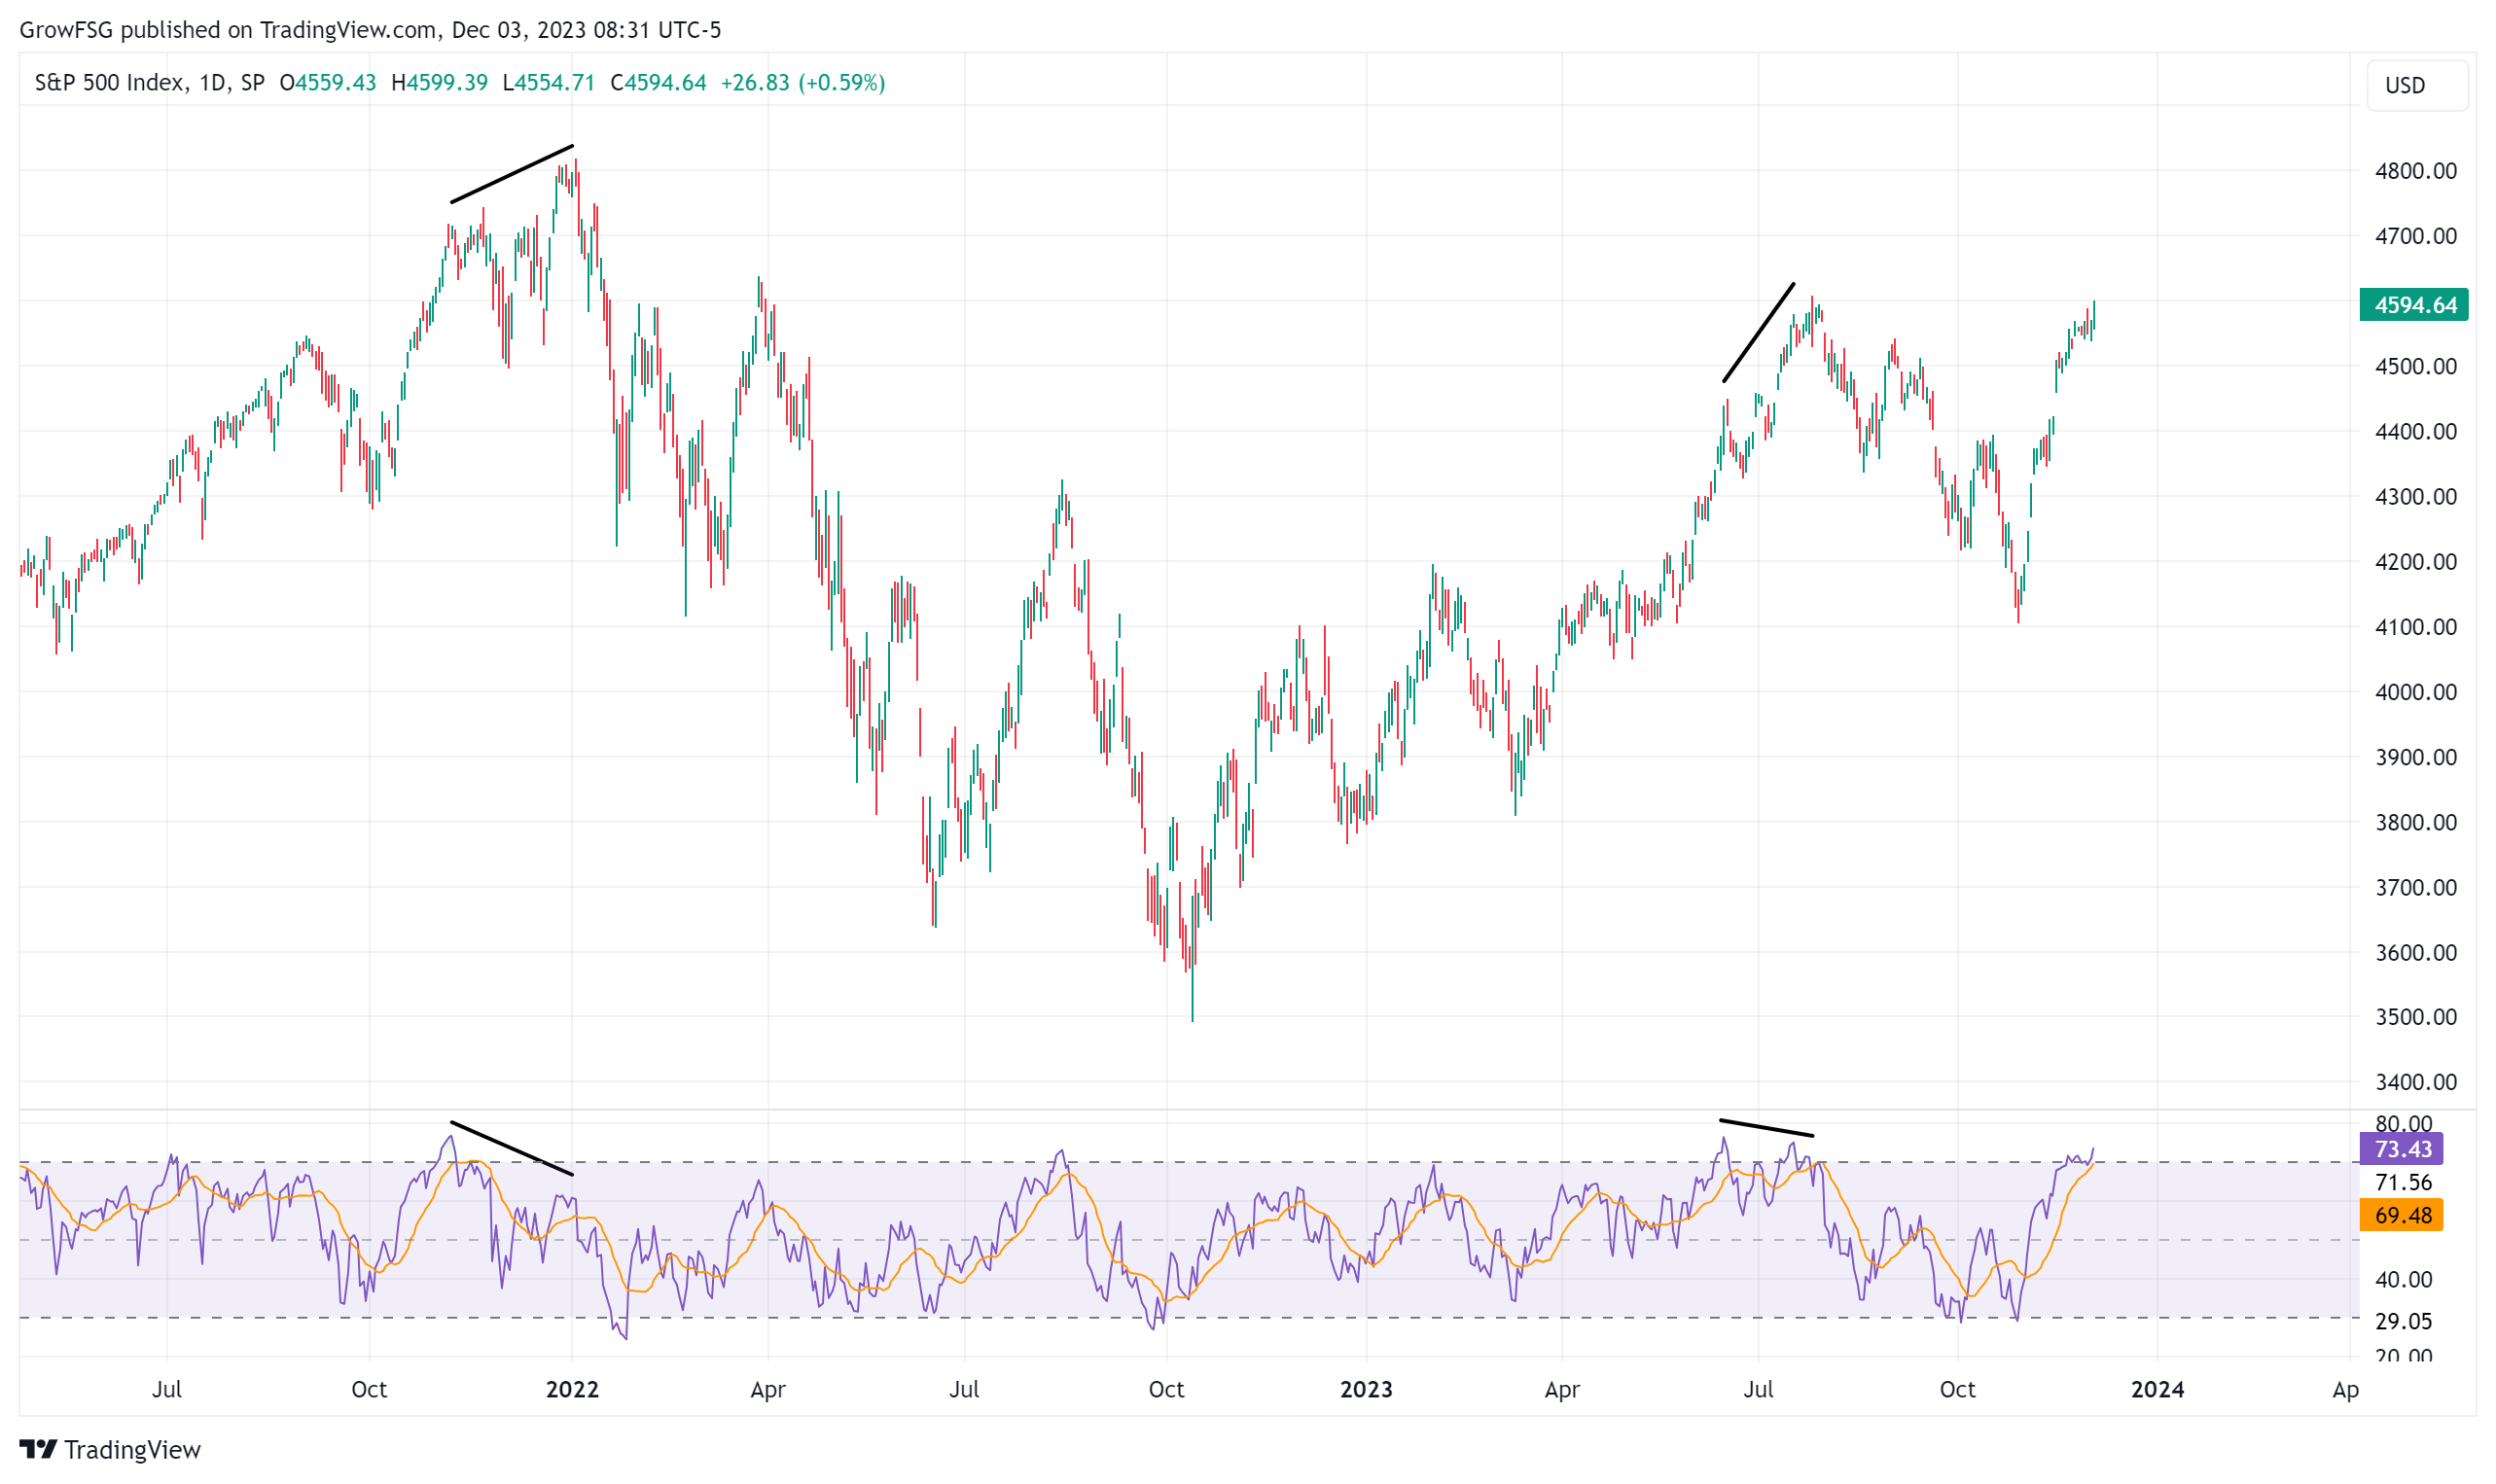
The S fund chart and RSI indicator are similar to the C fund. Every time the S fund price peaks as RSI hits 70, that's a top. However, as we saw in June, a 70 RSI does not mean the final top is in. A pull back to the 50 RSI line and a shallow pull back in price set the S fund up for another short move higher before rolling over. Could we see that over the next 2 weeks before a year end rally? Absolutely.
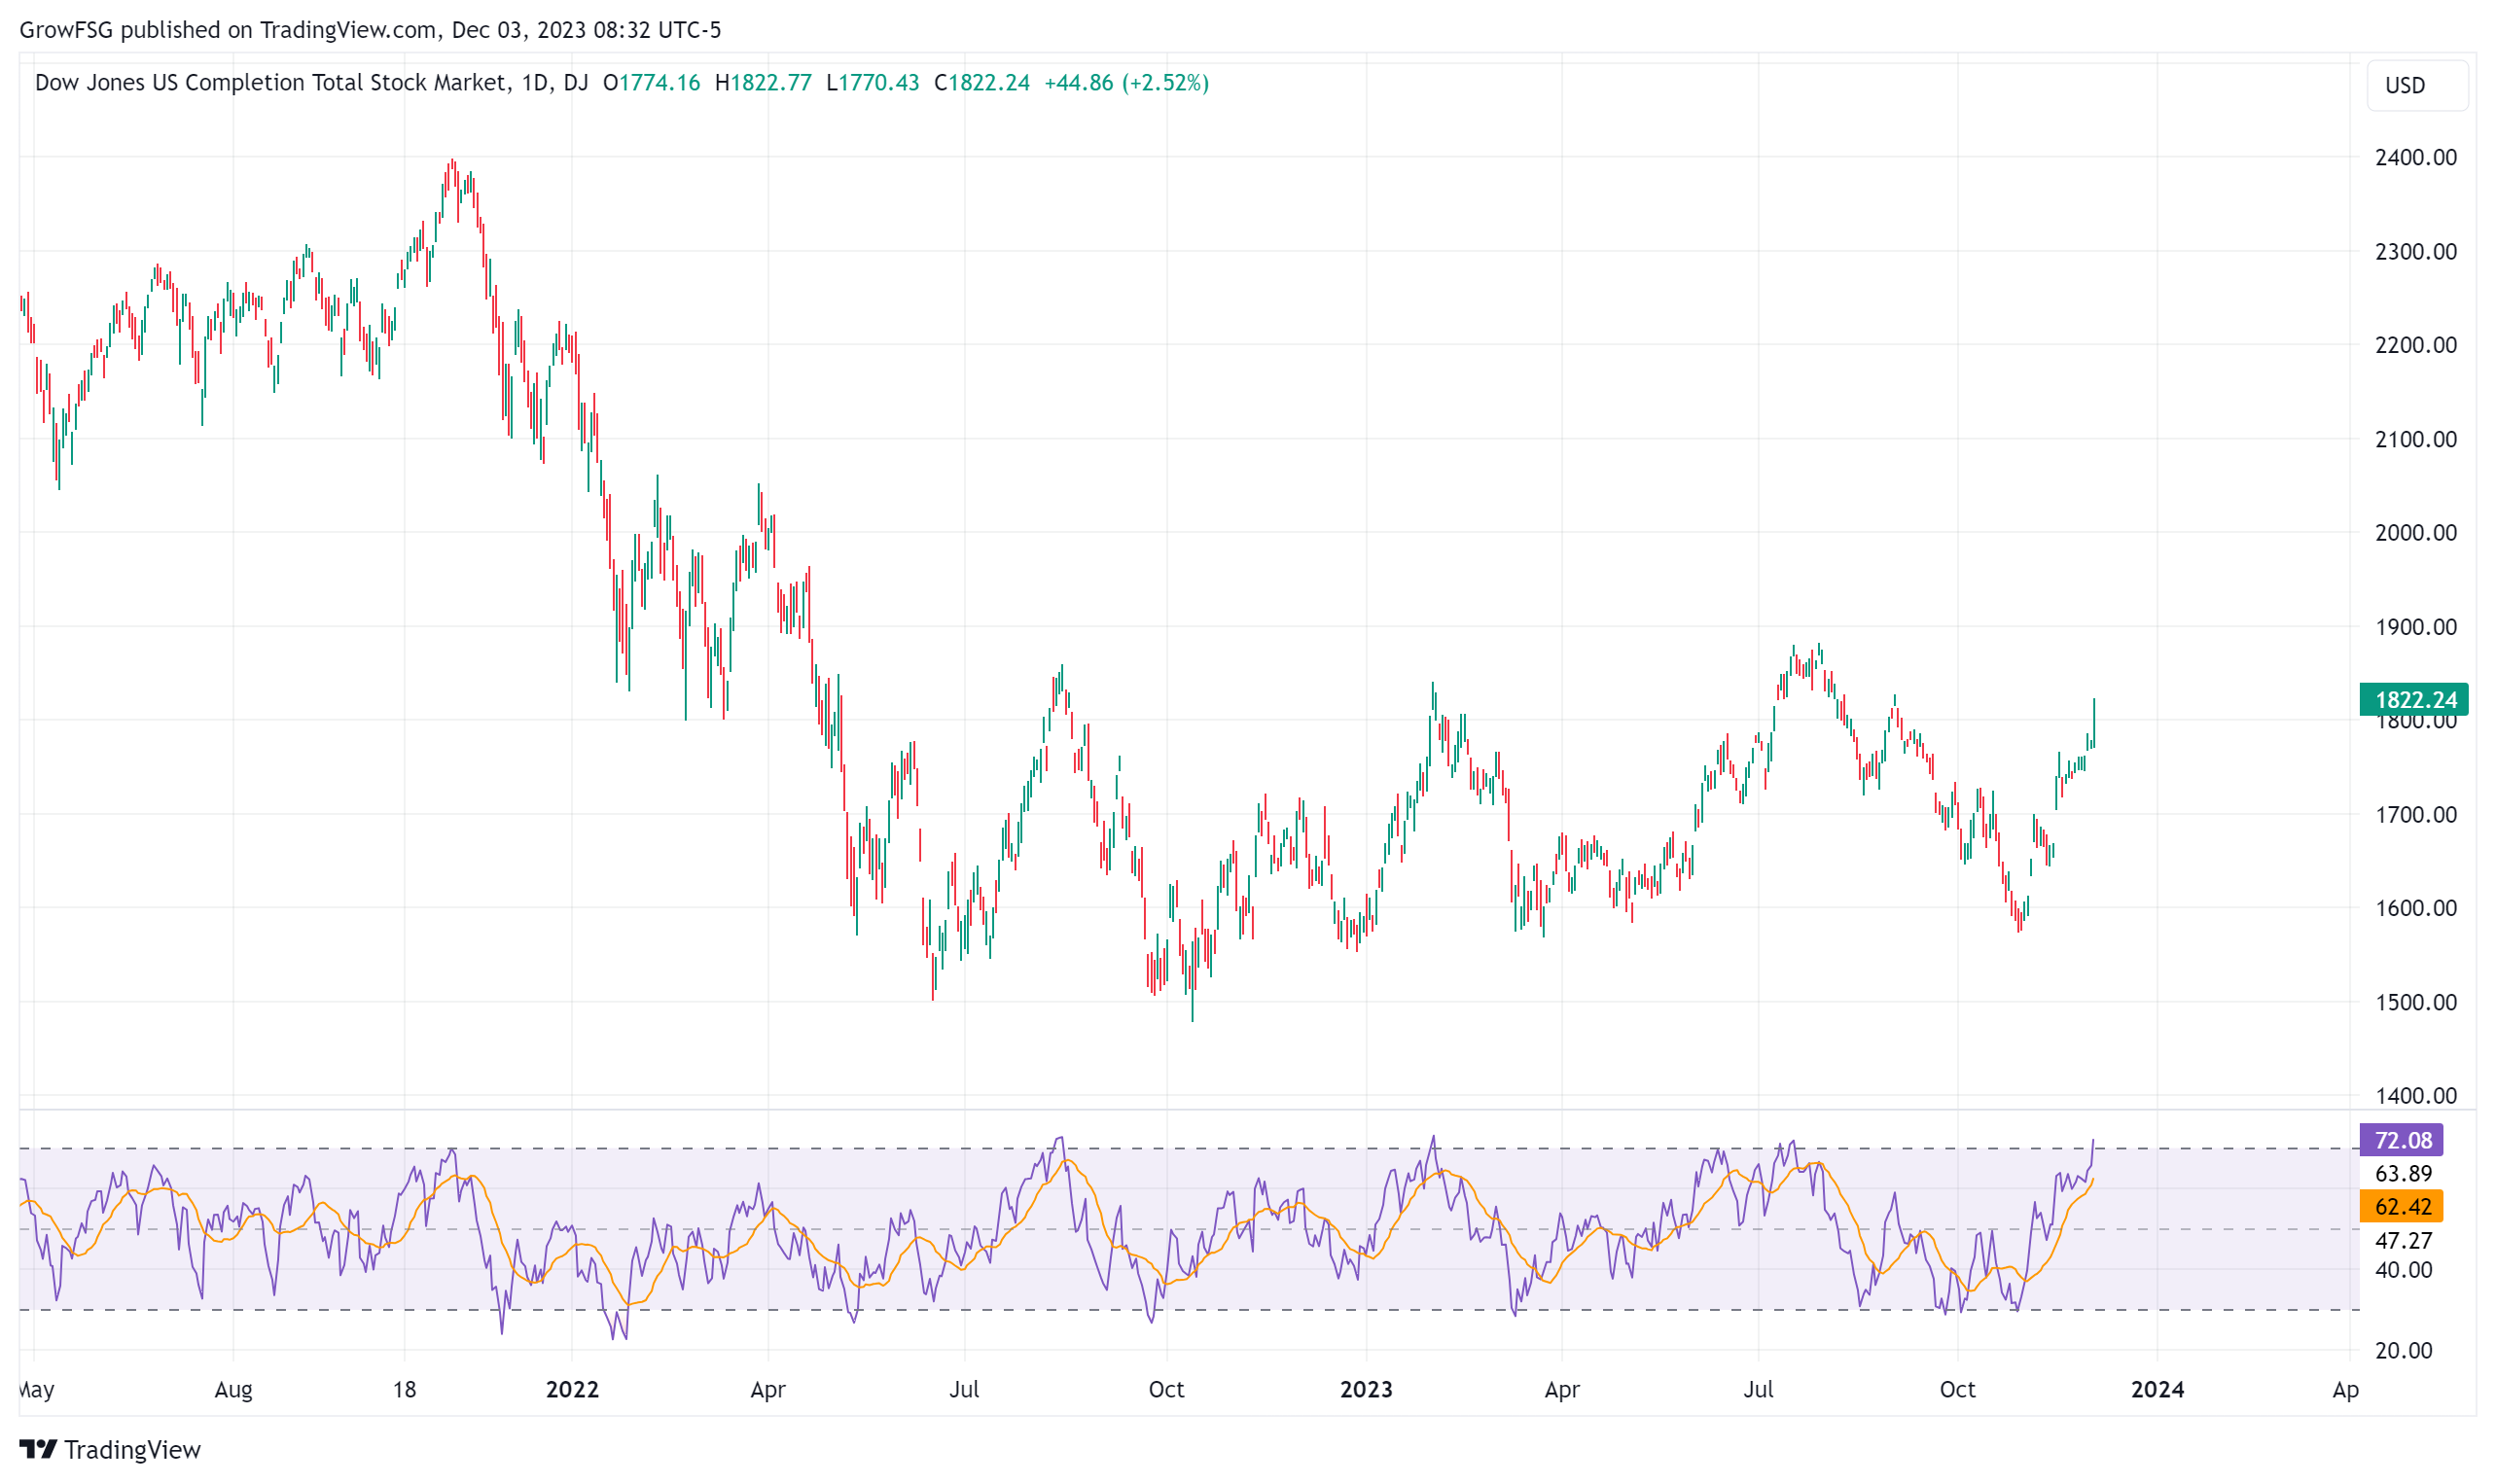
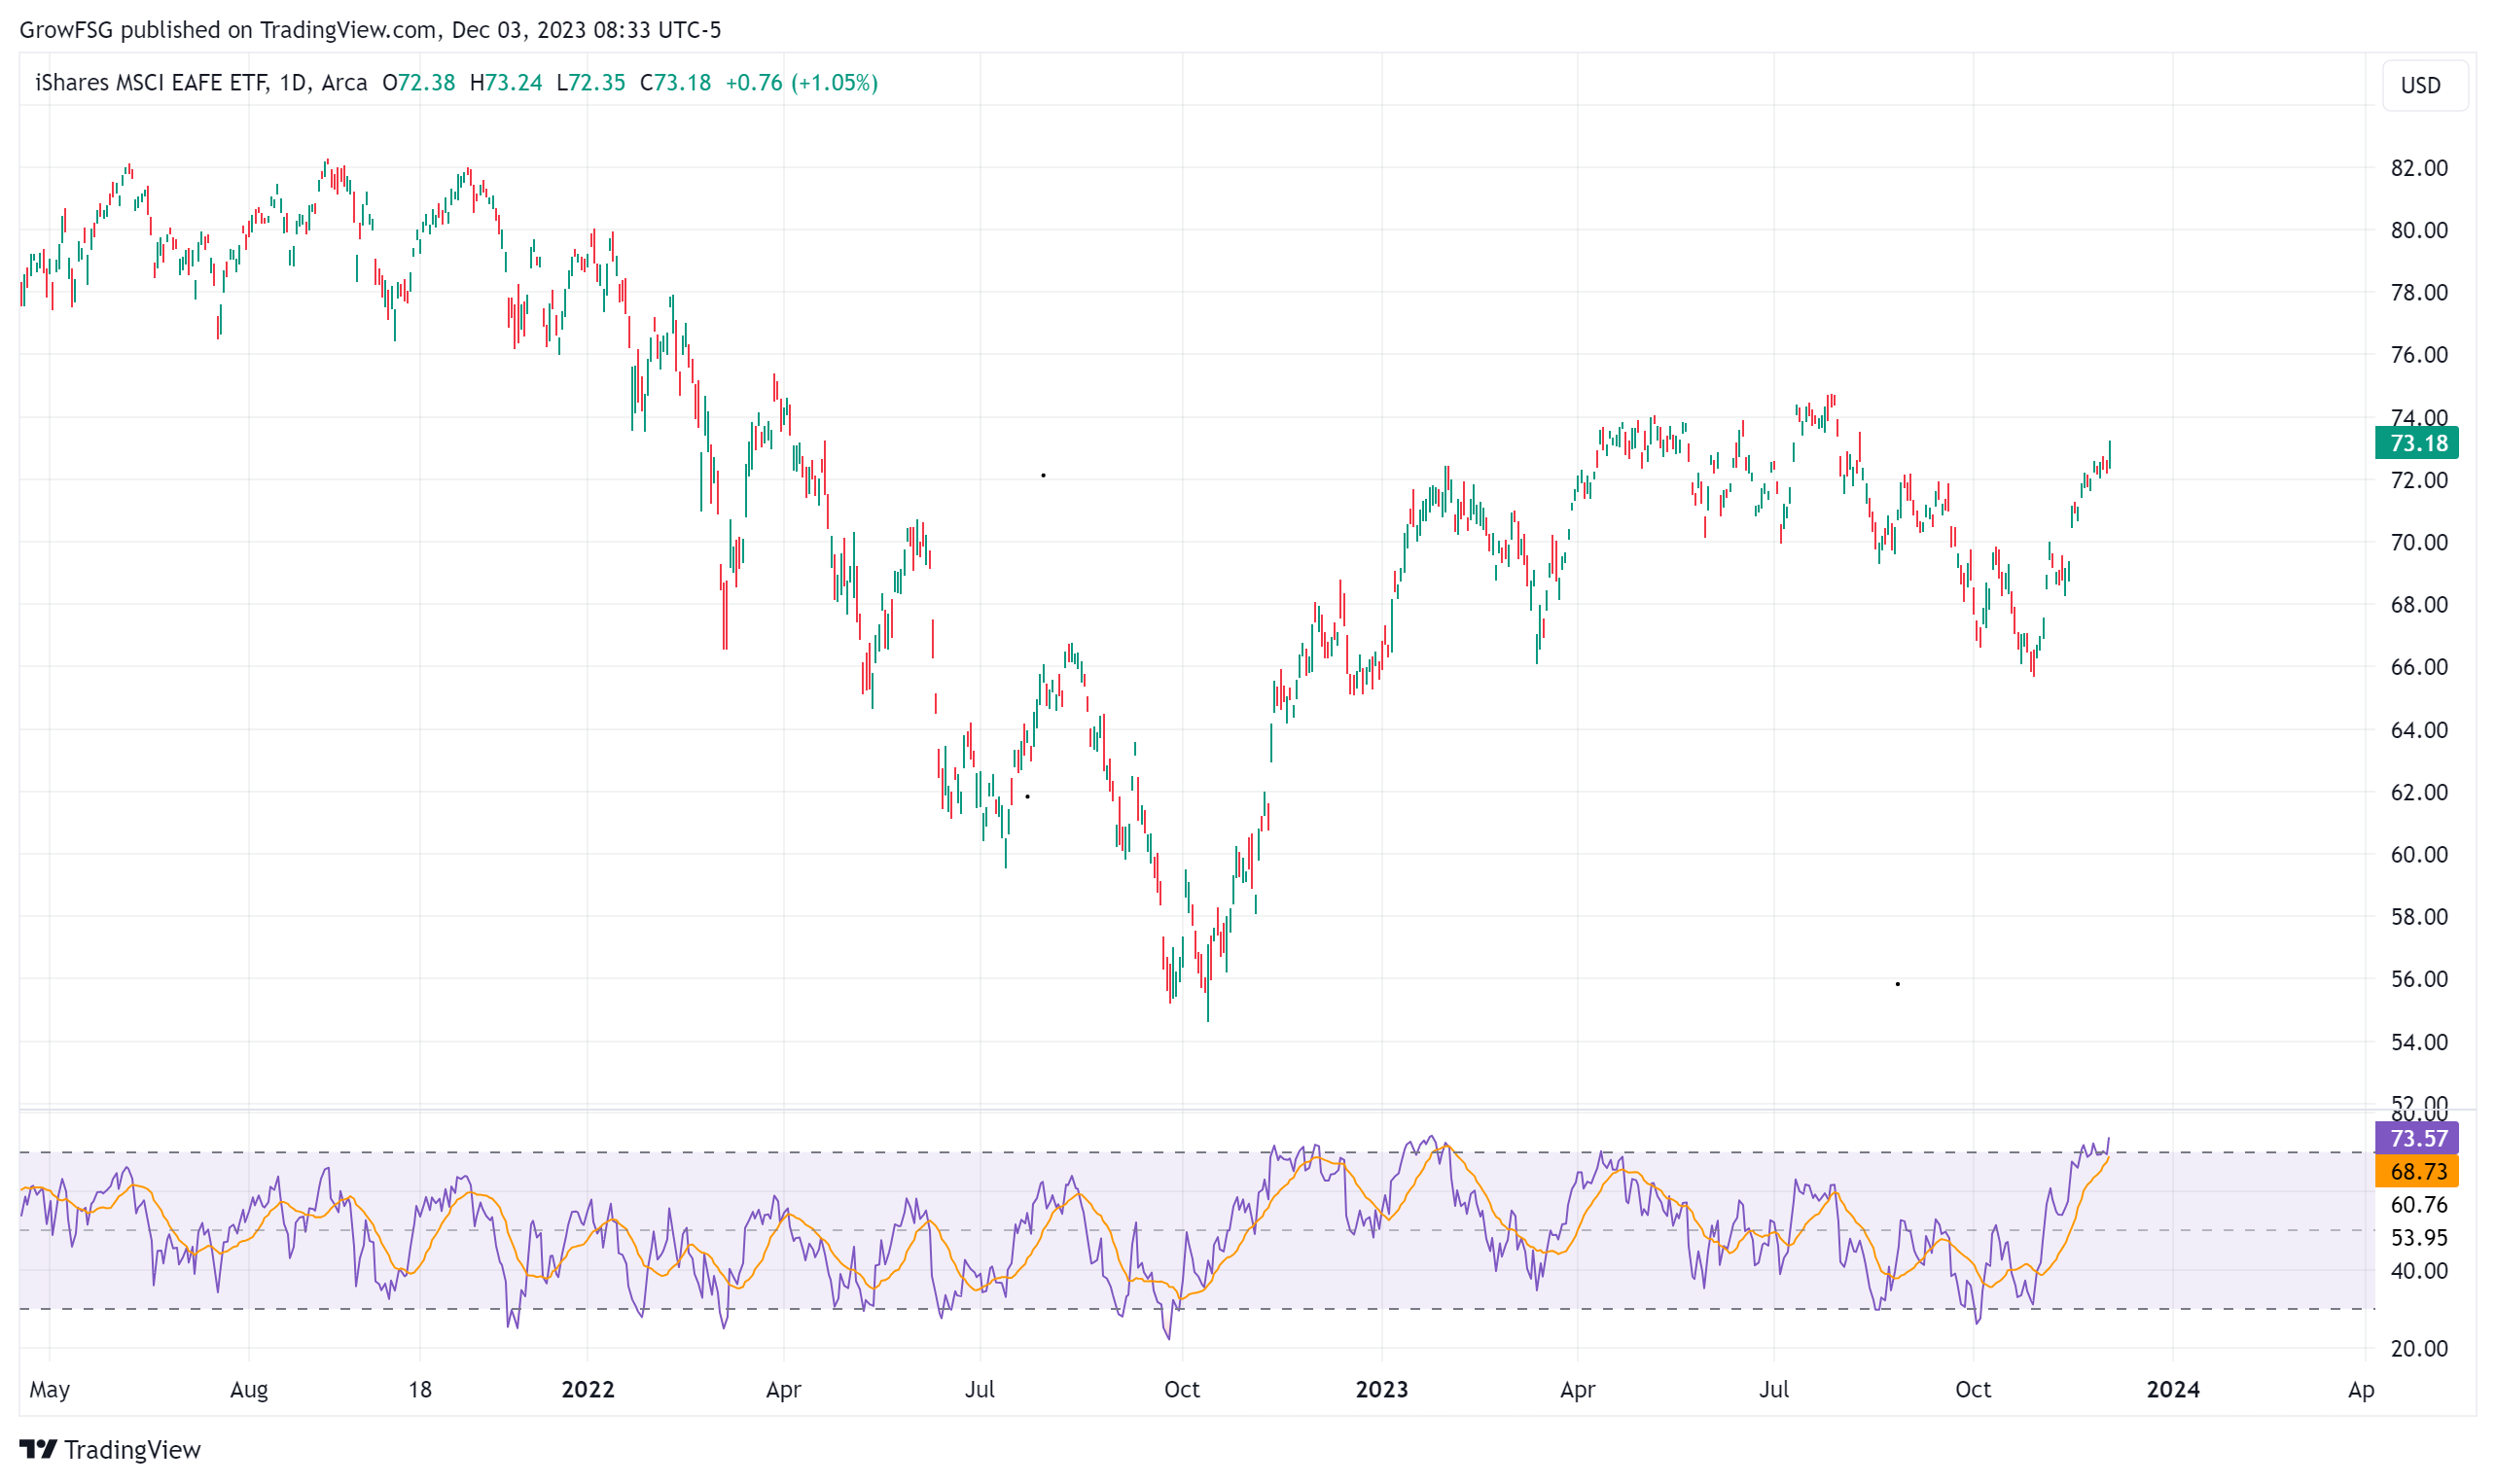
The I fund chart looks a lot like the C fund chart, or the inverse of the dollar chart. The I fund is overbought in the short term but could continue higher if the dollar continues lower. Ultimately, if the dollar is putting in a bottom, the I fund is putting in a top.
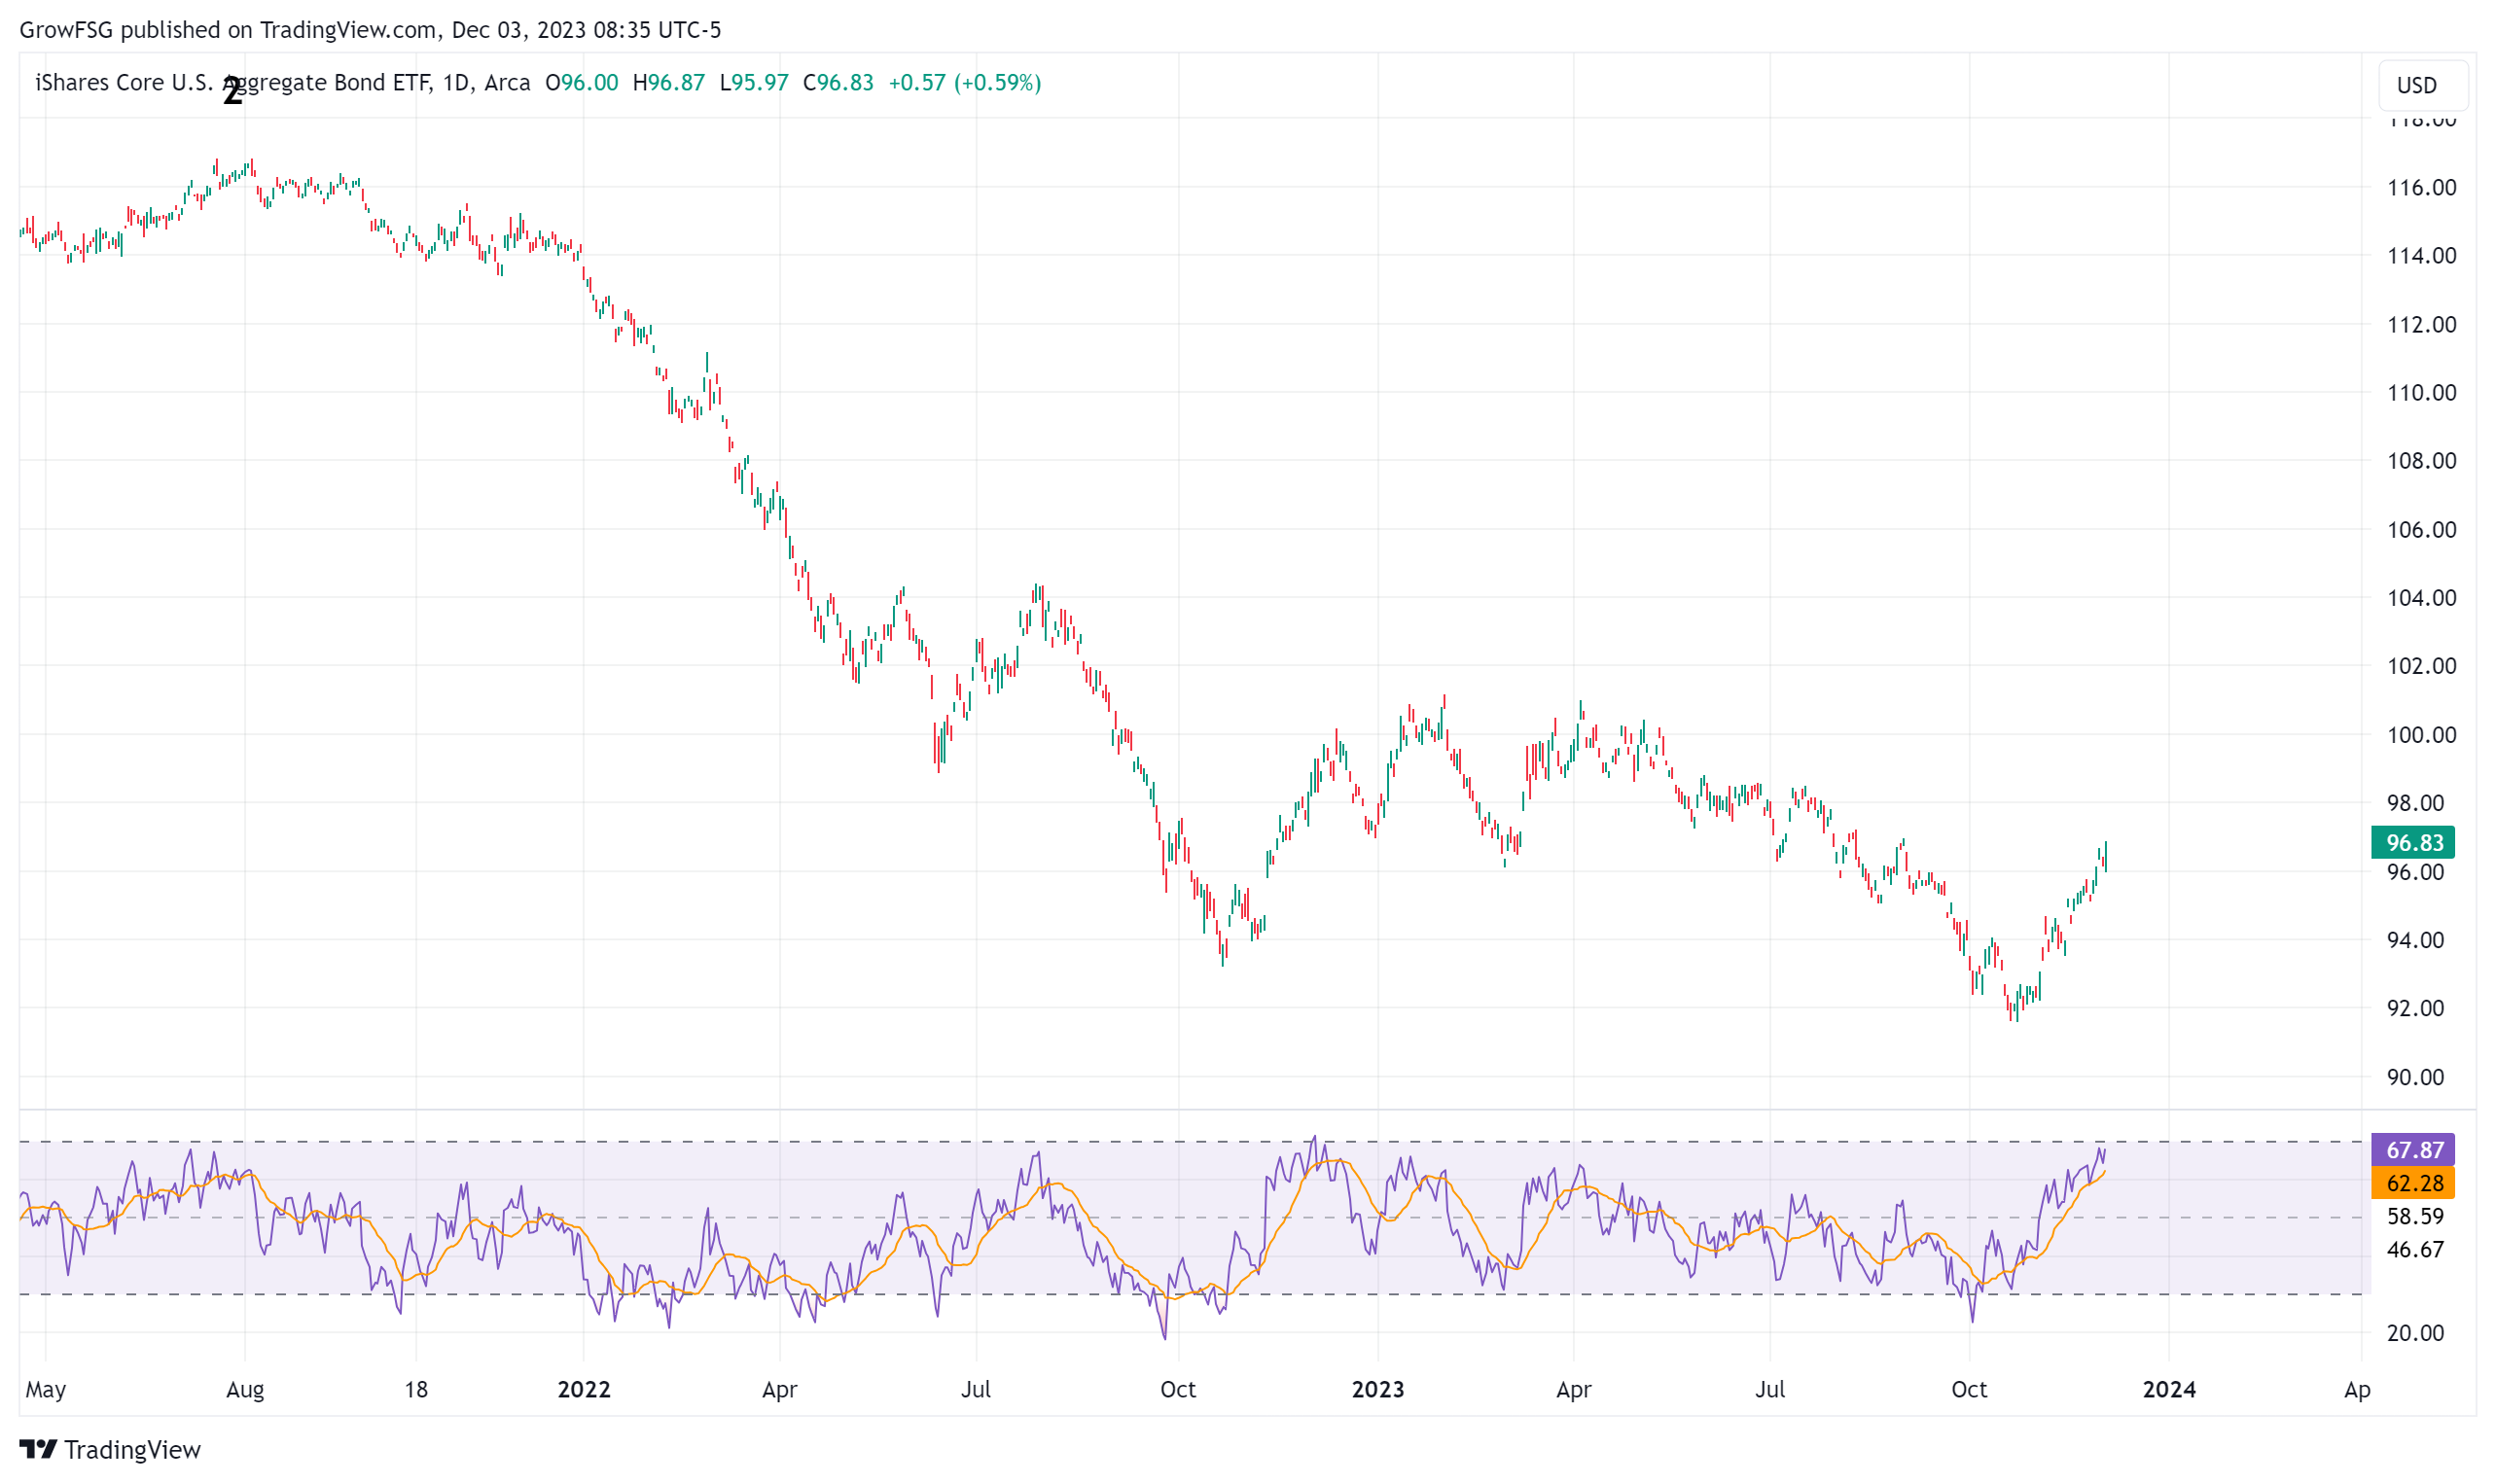
The F fund is also short term overbought with RSI almost at the 70 level. While we expect the rally in the F fund to continue, it's unlikely to happen in a straight line. Baring a significant economic event, we should expect a shallow pull back in the F fund, along with the stock funds, over the next 2 weeks. The rally in the F fund will continue as rates continue to fall in the medium term.
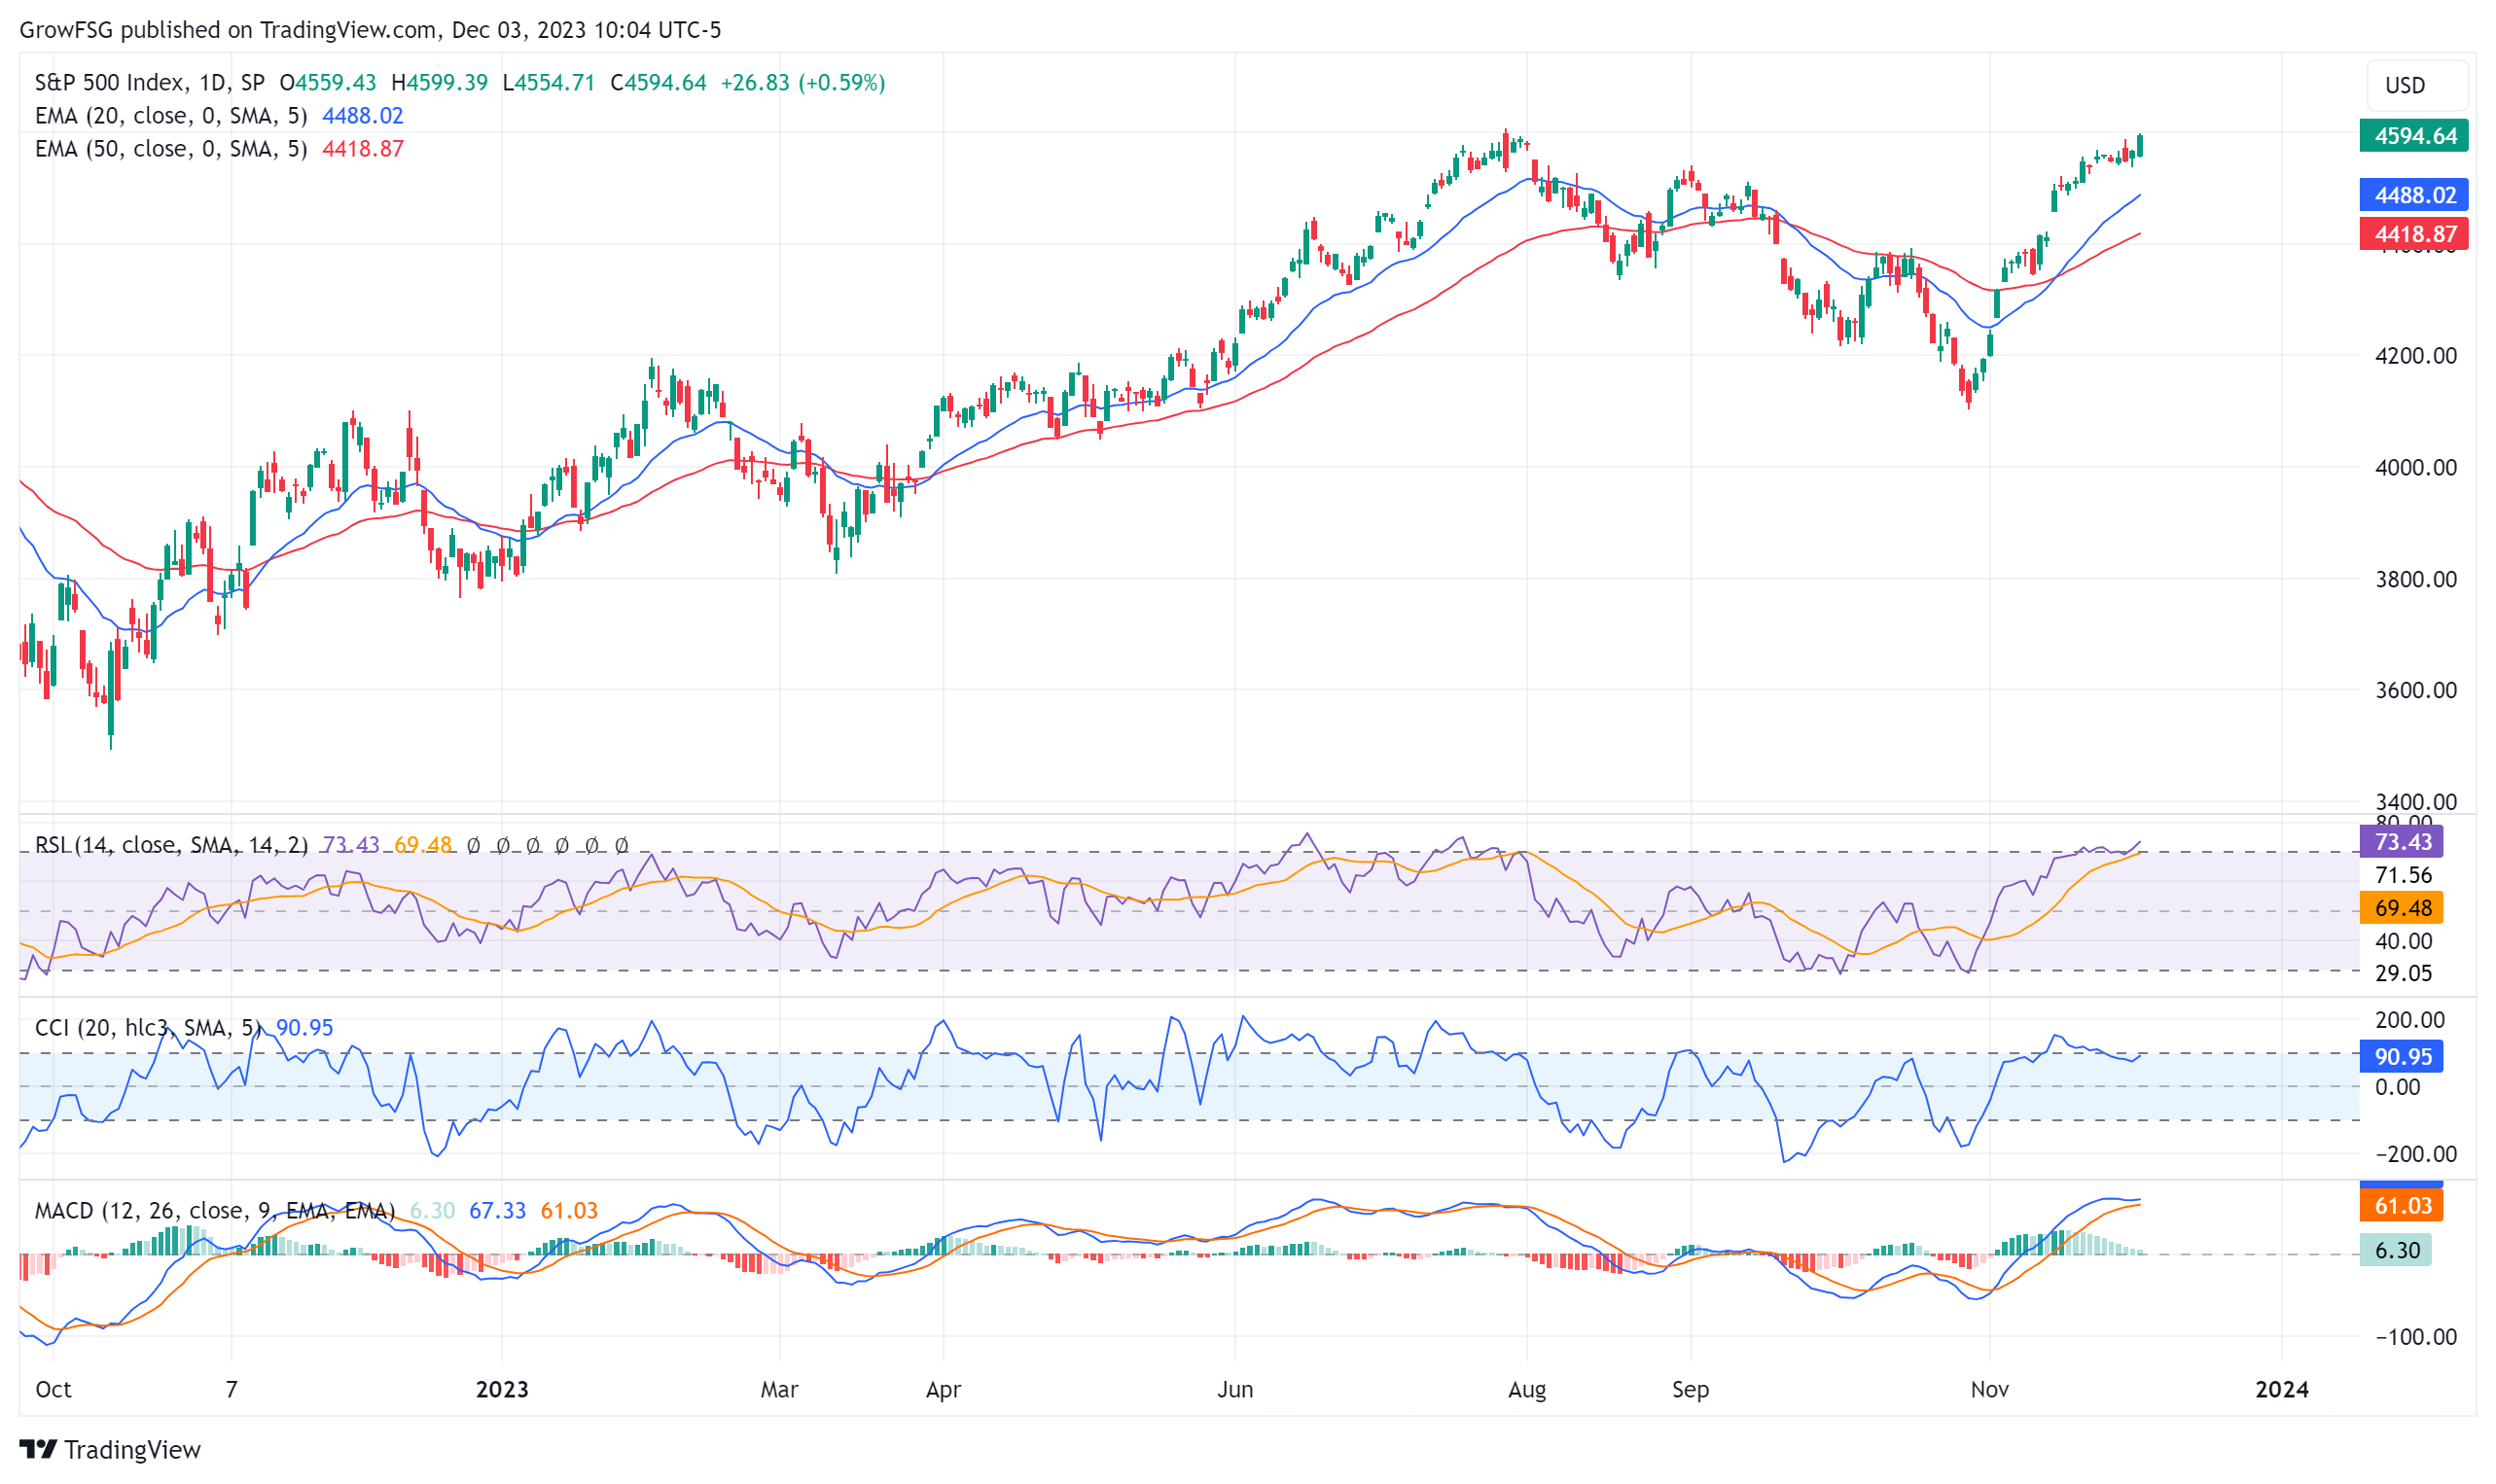
Before Friday's rally, the C fund had been basically flat for the prior 7 trading days. This gave the 20DMA line time to catch up. Price currently sits about 2.5% above the 20DMA, RSI is above 70, CCI is just below 100 and MACD is still positive. The C fund is clearly overbought and due for a pull back. The highest probability is that a pull back takes price down to the 20DMA, RSI to the 40-50 range, CCI to oversold, and MACD negative but only slightly. This is the ideal set-up for a year end rally.
The 50DMA line in red is the line in the sand. Any pull back that exceeds the 20DMA should find support at the 50DMA. A break below the 50DMA could see price testing the 4300 level or worse. This is the risk we want to avoid.
The Elliott Wave counts for both the Dollar and Yield give us a road map, or at least insight, into what is most probable in 2024. With both a rising dollar and rising yield, 2024 could be very challenging for stocks.
Have a great week!
The Grow My TSP Team
The Dollar
A rising dollar has been a headwind for stocks since mid-2021. The dollar peaked at wave I in October 2022 when the stock market bottomed. The dollar then bottomed at wave II in July, shortly before the peak in stock prices for 2023. IF the current Elliott Wave count is correct, the dollar should continue higher into wave III once intermediate wave 2 is complete.In the short term, wave 2 has hit the 0.618% retracement level of wave 1. It could continue down to the 0.786% level but cannot undercut wave II. A declining dollar is a tailwind for stocks. If the dollar continues to fall in the short term, stocks will continue to rally. Once the completion of wave 2 is confirmed, a rising dollar will be one of a number of headwinds for stocks.
Yield
All indications are that the 10 year yield has hit a peak at 5%. Yield has fallen significantly over the past month which has been a tailwind for stocks. While yield is oversold in the short term and due for a pull back, the medium term direction for yield is lower. What's important for us to watch is the pattern of the decline. IF the pattern plays out in an a-b-c correction, as is the current Elliott Wave count, this implies much higher yields in the future, once wave II is complete.The direction of yield is important but the WHY it moves in that direction is much more important. If yield continues to decline in an orderly a-b-c correction, with no major economic event, then stocks will continue to rally. If yield falls due to a flight to safety from a significant economic event, stocks will fall. The WHY yield falls is very important!
Conversely, if yield bottoms at wave a and begins to move higher, we would likely see a shallow pull back in stocks. A spike in yield, due to a massive rise in inflation, could cause stocks to collapse; again, the WHY matters!
The TSP Fund Charts
The C fund is clearly overbought and due for a pull back. As we can see going back to mid-2021, almost every time RSI hits 70, price rolls over significantly. There are 2 instances where this was not the case. In late 2021 and mid 2023, RSI peaked above 70, pulled back, but price continued higher. This is divergence between price and RSI. Divergence is a big red flag but, takes time to play out. Right now, there is no divergence between price and RSI.The S fund chart and RSI indicator are similar to the C fund. Every time the S fund price peaks as RSI hits 70, that's a top. However, as we saw in June, a 70 RSI does not mean the final top is in. A pull back to the 50 RSI line and a shallow pull back in price set the S fund up for another short move higher before rolling over. Could we see that over the next 2 weeks before a year end rally? Absolutely.
The I fund chart looks a lot like the C fund chart, or the inverse of the dollar chart. The I fund is overbought in the short term but could continue higher if the dollar continues lower. Ultimately, if the dollar is putting in a bottom, the I fund is putting in a top.
The F fund is also short term overbought with RSI almost at the 70 level. While we expect the rally in the F fund to continue, it's unlikely to happen in a straight line. Baring a significant economic event, we should expect a shallow pull back in the F fund, along with the stock funds, over the next 2 weeks. The rally in the F fund will continue as rates continue to fall in the medium term.
Before Friday's rally, the C fund had been basically flat for the prior 7 trading days. This gave the 20DMA line time to catch up. Price currently sits about 2.5% above the 20DMA, RSI is above 70, CCI is just below 100 and MACD is still positive. The C fund is clearly overbought and due for a pull back. The highest probability is that a pull back takes price down to the 20DMA, RSI to the 40-50 range, CCI to oversold, and MACD negative but only slightly. This is the ideal set-up for a year end rally.
The 50DMA line in red is the line in the sand. Any pull back that exceeds the 20DMA should find support at the 50DMA. A break below the 50DMA could see price testing the 4300 level or worse. This is the risk we want to avoid.
Bottom Line
In the very short term, we are anticipating a pull back. The highest probability is that we see a shallow pull back and a rally into the beginning of 2024. Beyond that, the long term direction of both the dollar and yield, along with a host of macroeconomic concerns, call into question a sustained bull market.The Elliott Wave counts for both the Dollar and Yield give us a road map, or at least insight, into what is most probable in 2024. With both a rising dollar and rising yield, 2024 could be very challenging for stocks.
Have a great week!
The Grow My TSP Team
RELATED READS

Copyright Grow Investments, LLC | GrowMyTSP.com
Thrift Savings Plan Disclaimer
Neither growmytsp.com nor any of its partners or representatives is in any way affiliated with the United States Government, The Federal Retirement Thrift Investment Board (FRTIB.gov) or the Thrift Savings Plan (TSP.gov), and any service being offered is not sanctioned by the United States Government, the Federal Retirement Thrift Investment Board or the Thrift Savings Plan.