
TSP Weekly Newsletter
TSP Weekly Newsletter
September 1, 2024
Friday's afternoon rally pulled the S&P500 into the green for the week. Trading volume on Friday was significantly higher than it has been since the beginning of August. This is unusual given it was the Friday before the long Labor Day weekend. The S&P closed higher for the day, the week, and put in a new monthly all-time high. Investors are clearly not concerned about holding long positions going into the most volatile months of the year for the market. This is all very bullish price action. For the week the C fund finished up 0.24%, S fund down 0.03%, I fund up 0.19%, and the F fund down 0.52%.
Market sentiment can be measured in a number of ways. Three simple but valuable metrics are the Put/Call Ratio, the VIX, and the CNN Fear & Greed Index. On Friday, the Put/Call ratio fell along with the VIX. The Fear & Greed index closed the day at 63 with plenty of room to move higher before showing an overbought level. The combination of Friday's price action, volume of shares traded, and the sentiment indicators is telling us that the market wants to move higher. While there are plenty of macro-economic, geopolitical, and seasonal concerns, our focus needs to be on price action and what is actually happening now.
In this Newsletter, we'll take a look at the current trend from a top down approach. We'll look at monthly, weekly, and daily charts to determine the trend on different timeframes and identify important areas of support and potential resistance.
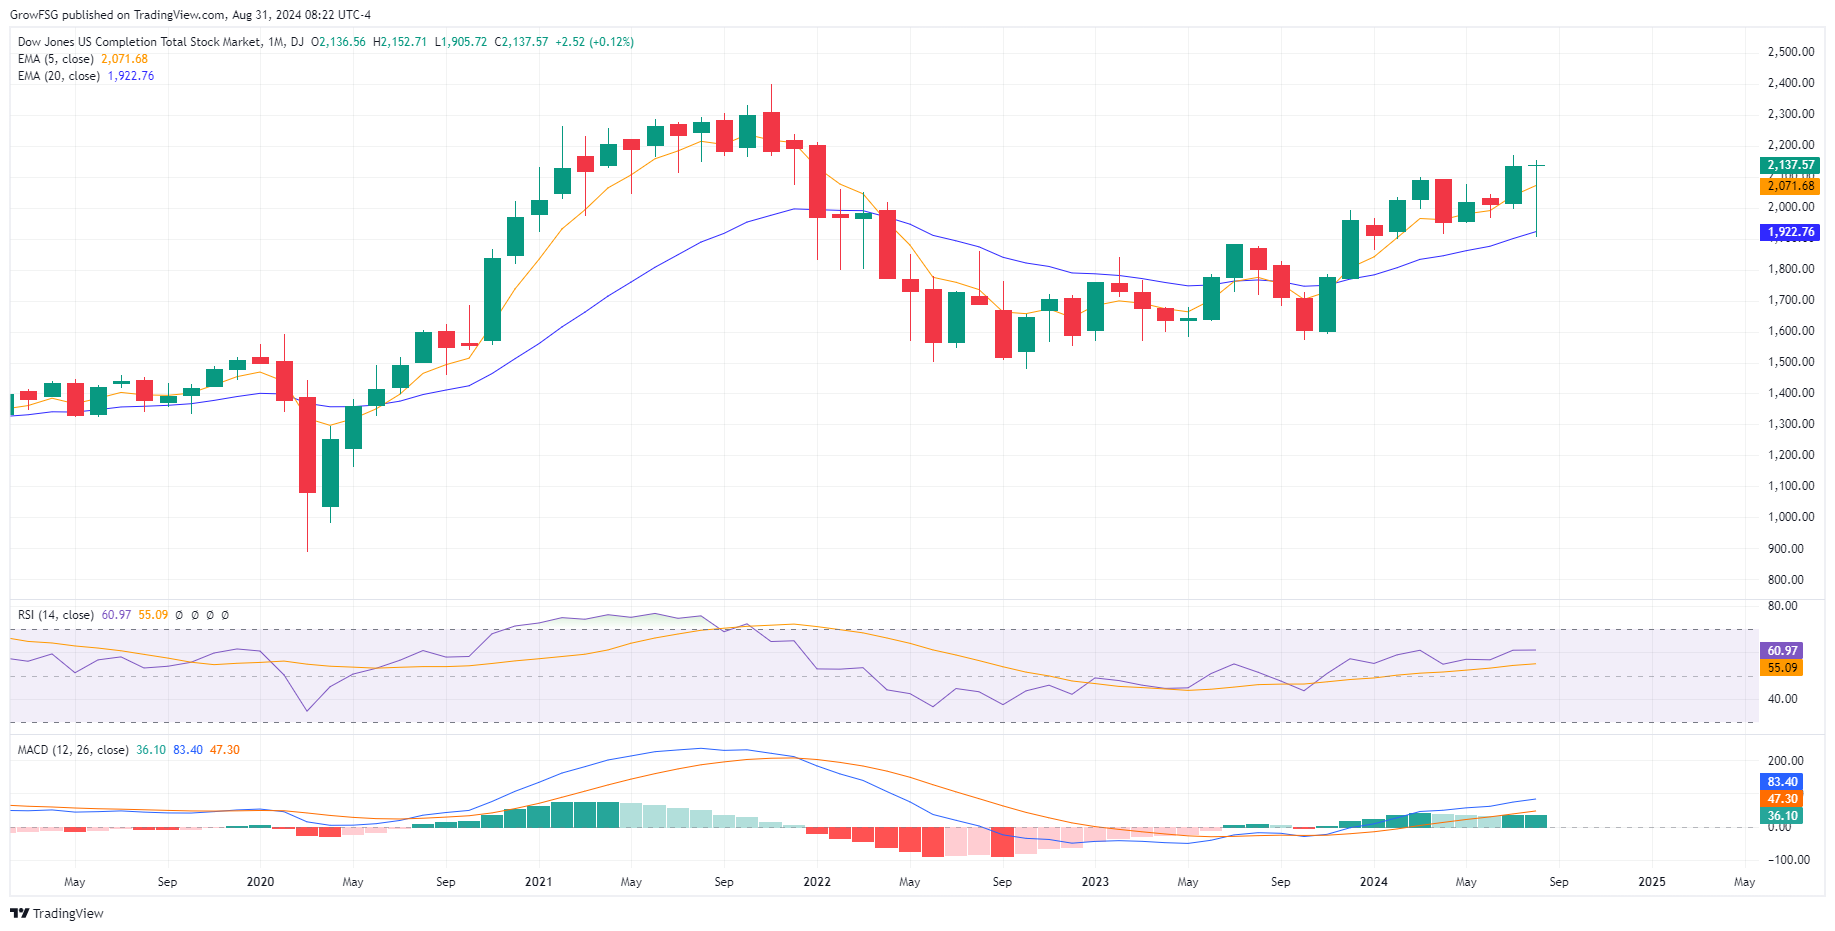
The S fund is still well off its all-time high set back in late 2021. While the S fund has been lagging the C fund since 2021, the bulls are hopeful that lower interest rates will result in S fund outperformance going forward. This can be seen in the August hammer. The S fund fell all the way down to its 20 MMA (Month Moving Average) before recovering all the way back to where it opened the month. Like the C fund, this is very bullish price action.
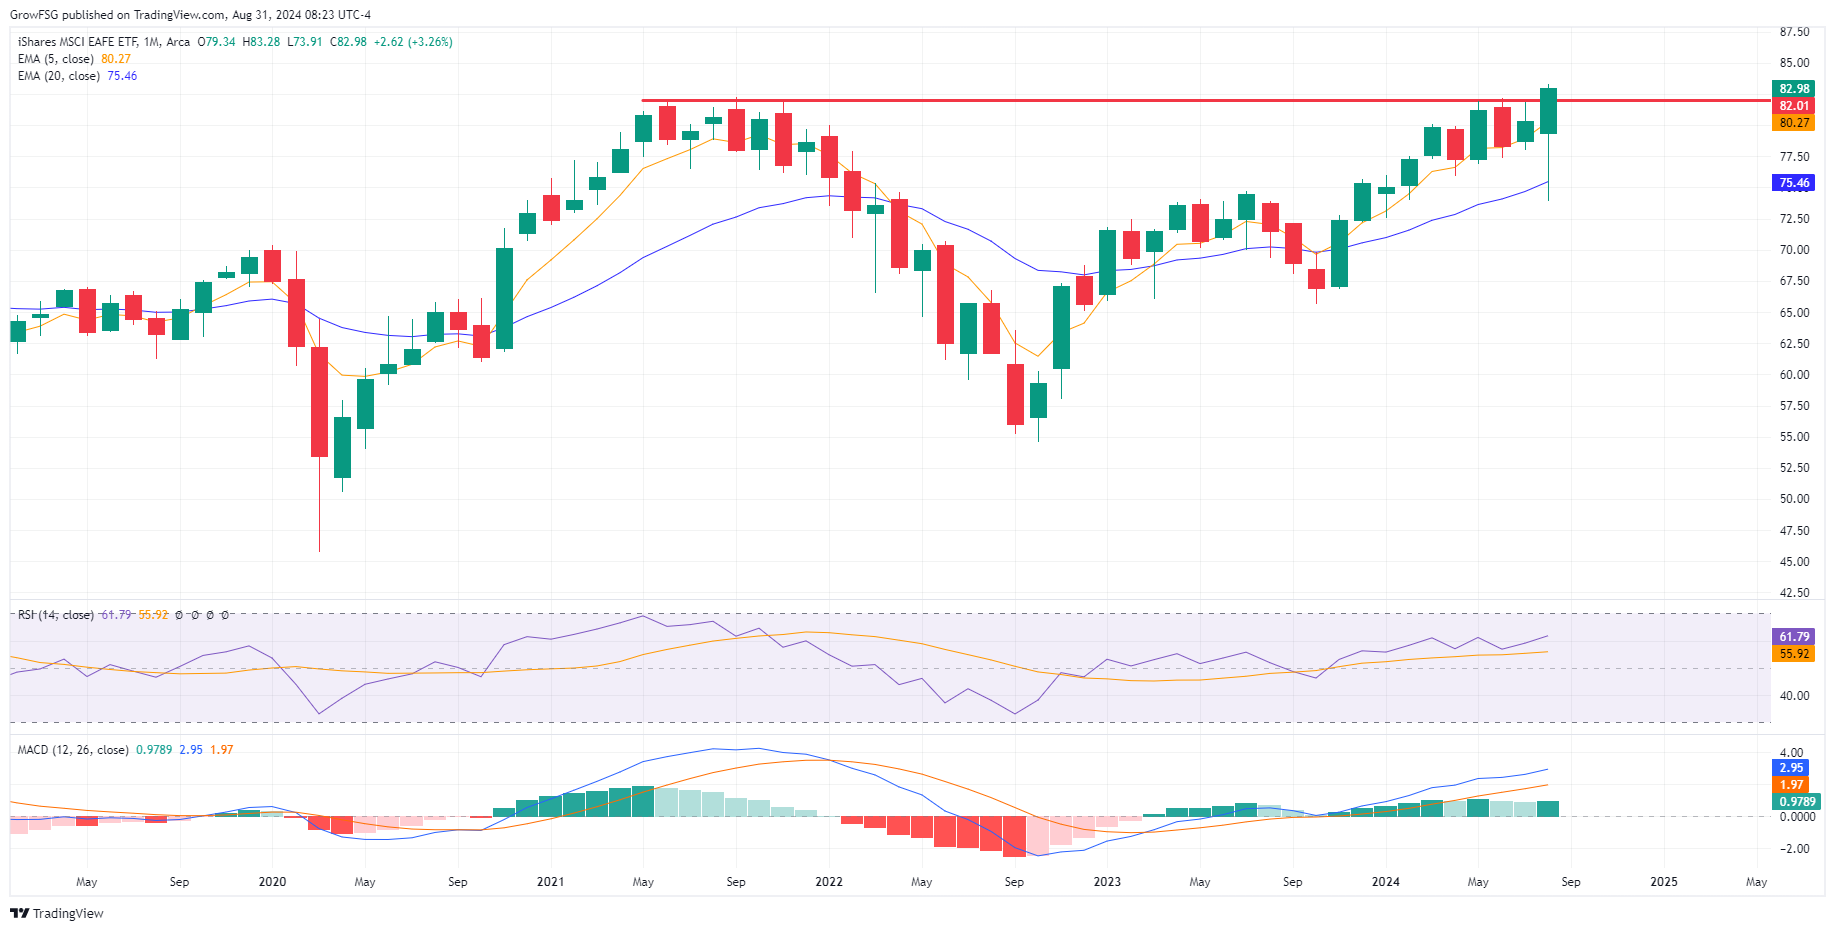
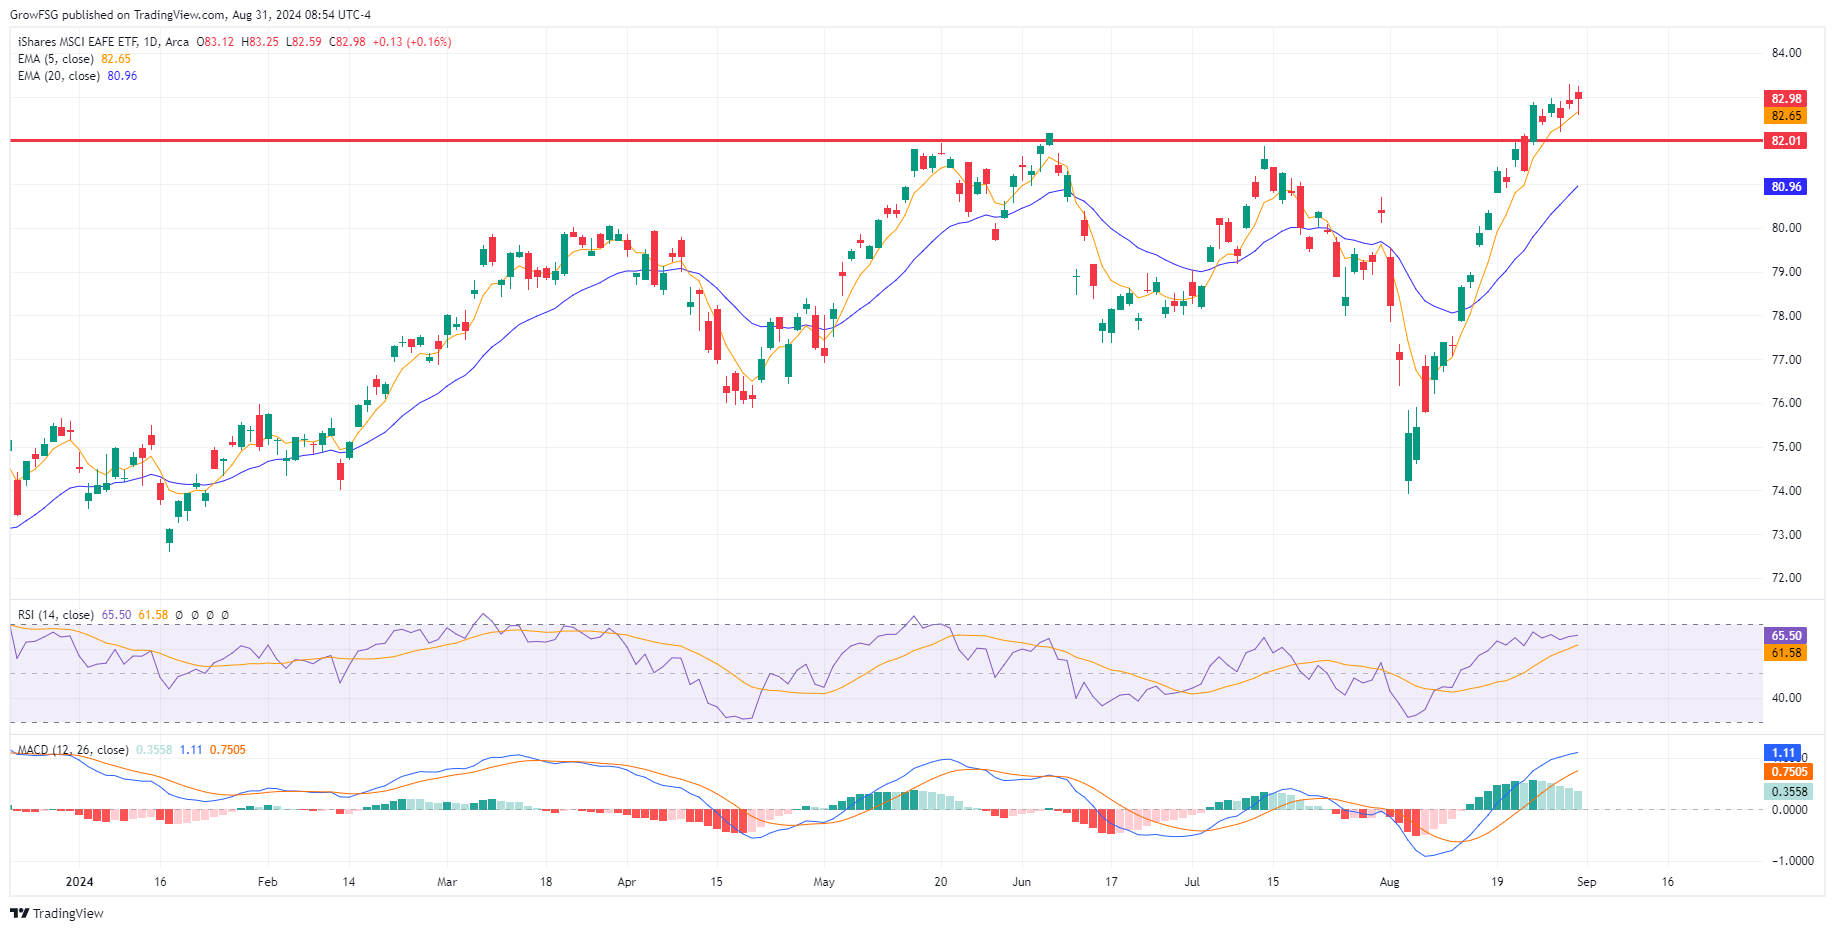
The I fund finally closed a month above the 82 level. This has been resistance since mid-2021. While it was an extremely volatile month for the I fund, this closing price is significant. With RSI having room to move higher and MACD expanding to the upside, the I fund is looking very strong on a monthly basis.
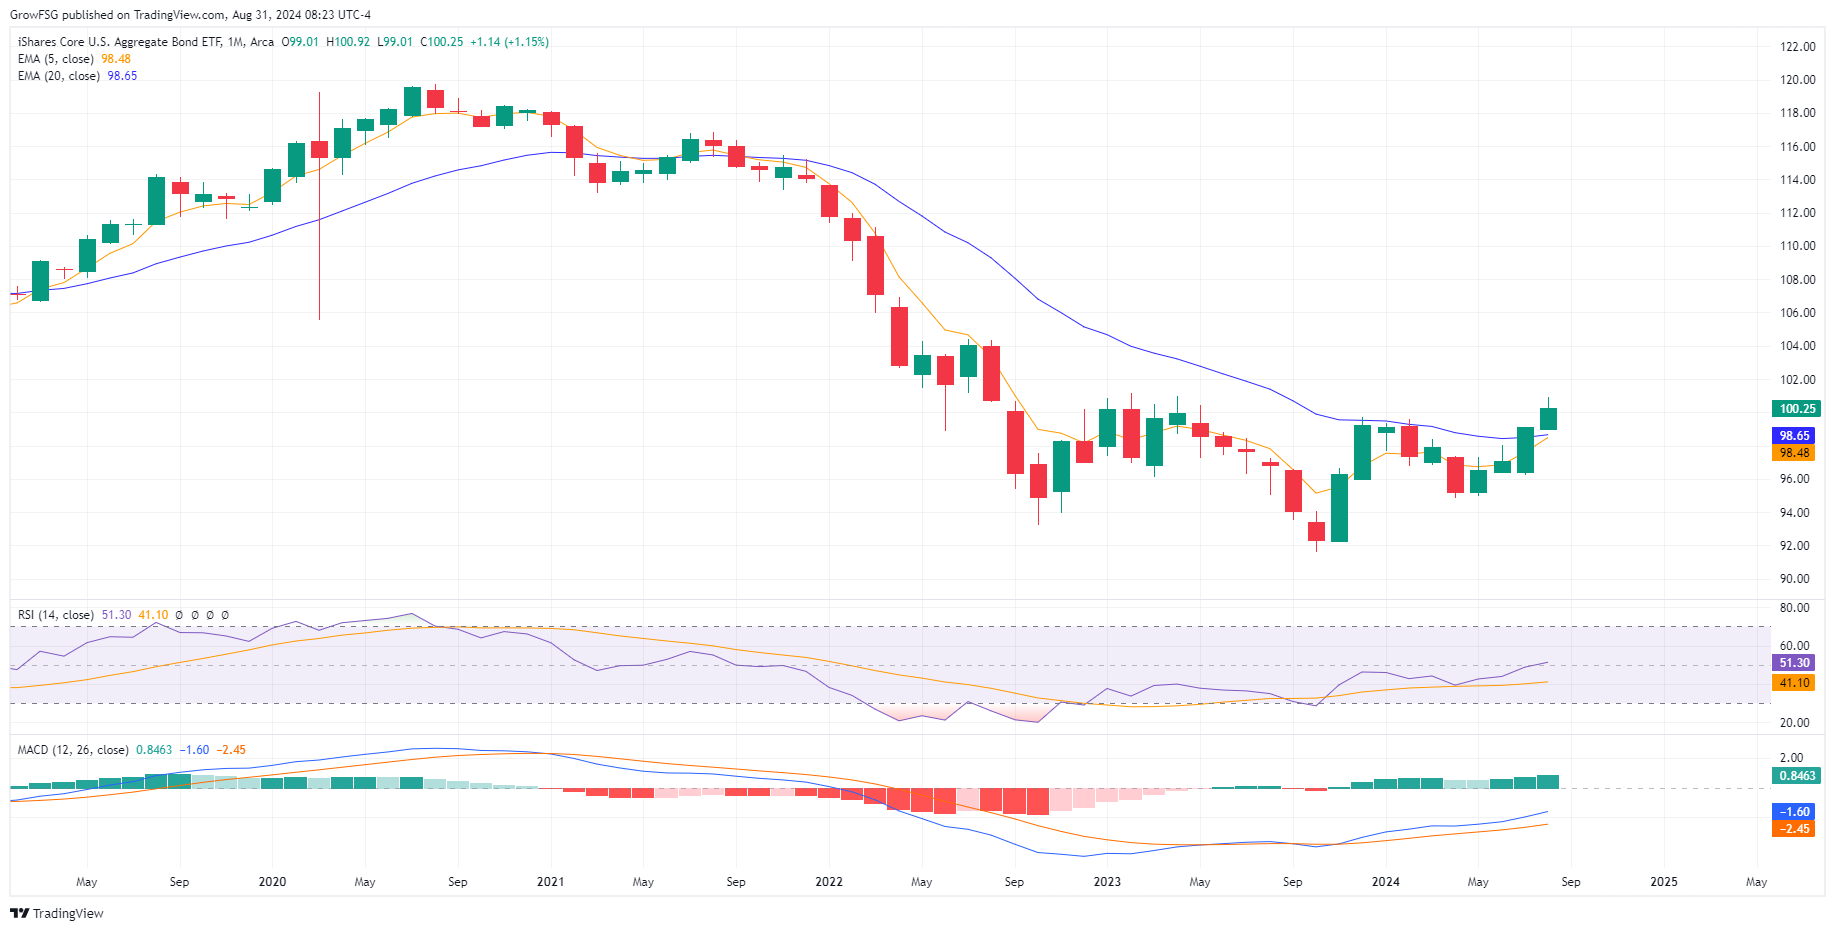
The rally in the F fund continued this month as the 5 month moving average is about to cross above the 20 month moving average. This is a very bullish cross that we have not seen since mid-2019. We now have a clear uptrend on a monthly basis with a higher low and a higher high. RSI just broke through 50 and MACD is expanding, giving the F fund plenty of room for gains before becoming overvalued.
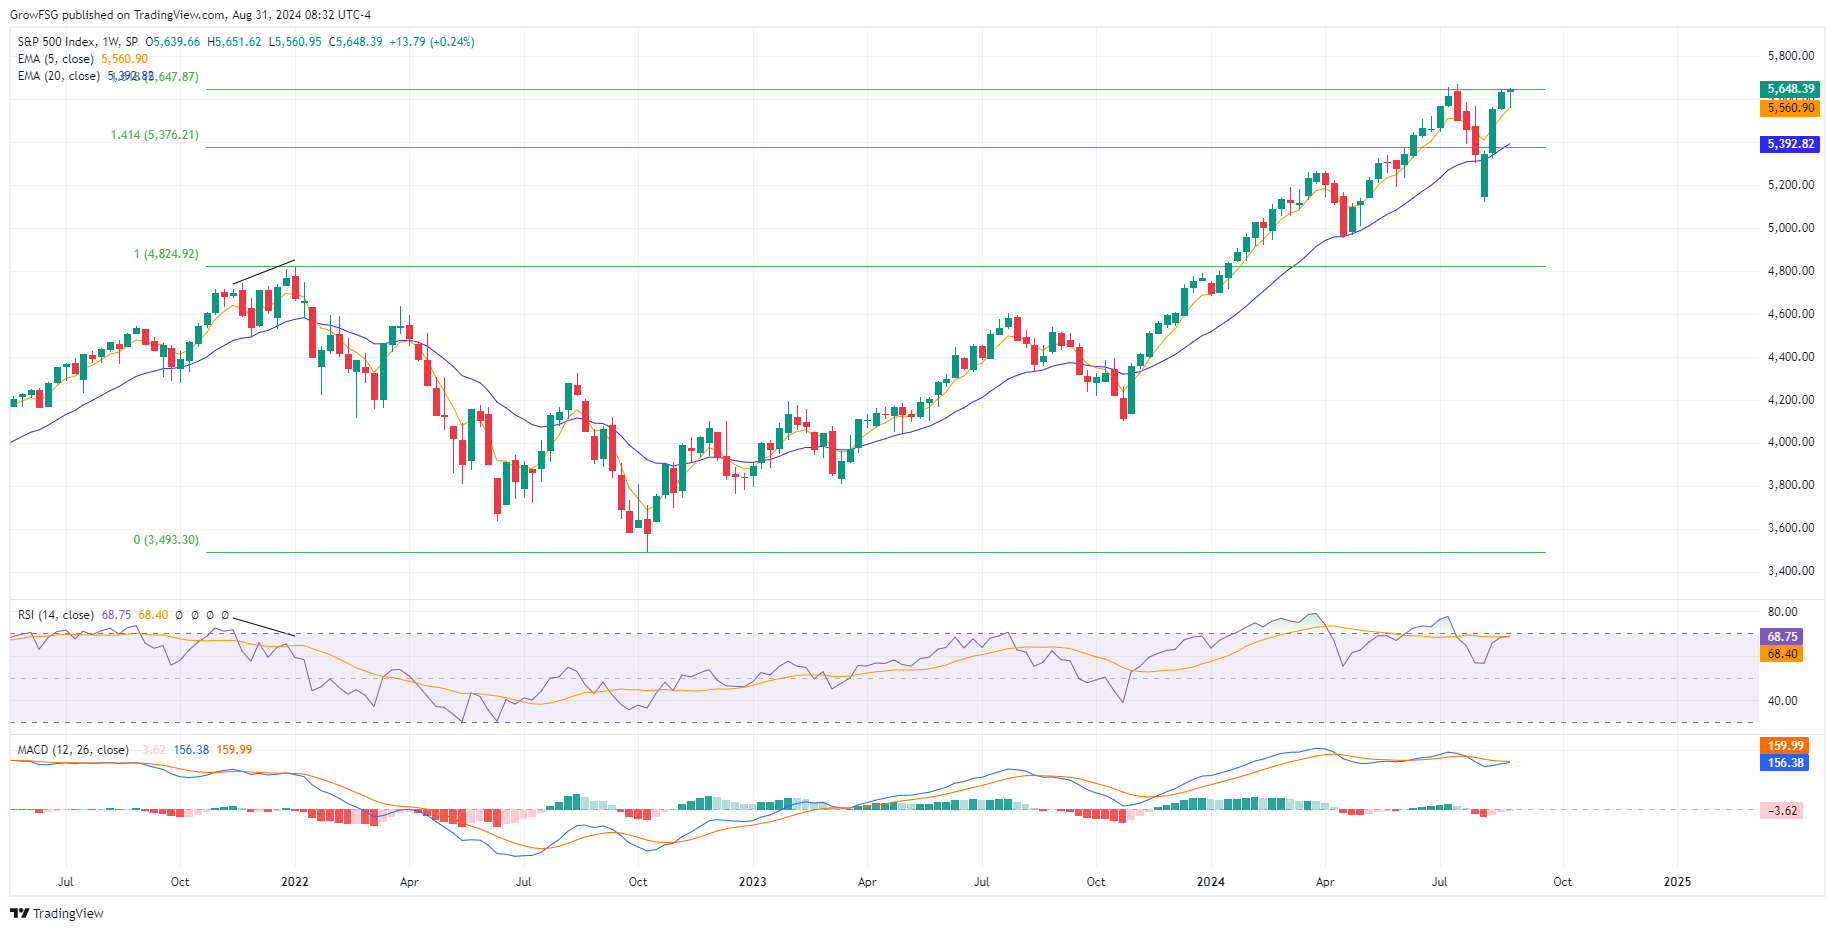
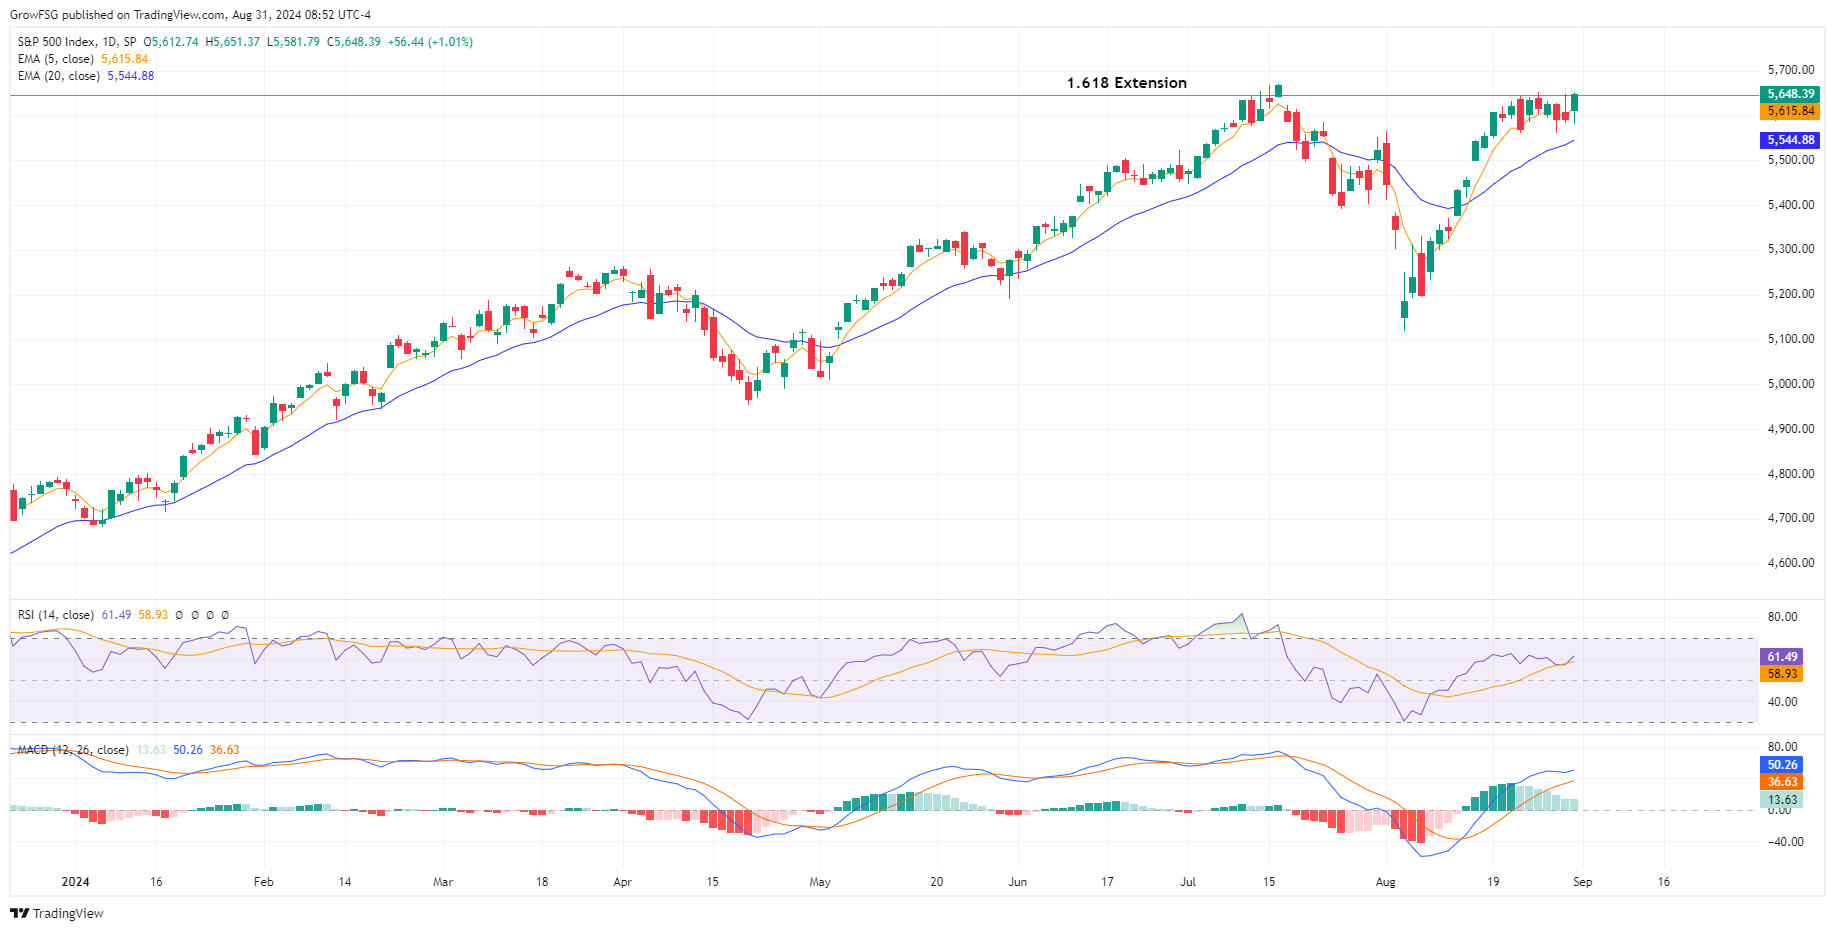
The weekly chart of the C fund shows price hitting resistance at the 1.618 extension. It has hit this level 4 times on a weekly basis. The 1.618 Fibonacci extension level is important as it is the most common level for a major trend reversal. When we don't see a reversal at this level, it is telling us that the uptrend is very strong and likely to continue. Bulls want to see RSI and MACD expand to the upside at the 1.618 level is taken out. This would show strong momentum for the continued rally. We aren't really seeing that right now but, we do not yet have confirmed divergence either. Going into the 2022 top, we see confirmed divergence between price and RSI. IF price continues higher but RSI rolls over, this will be a very big red flag.
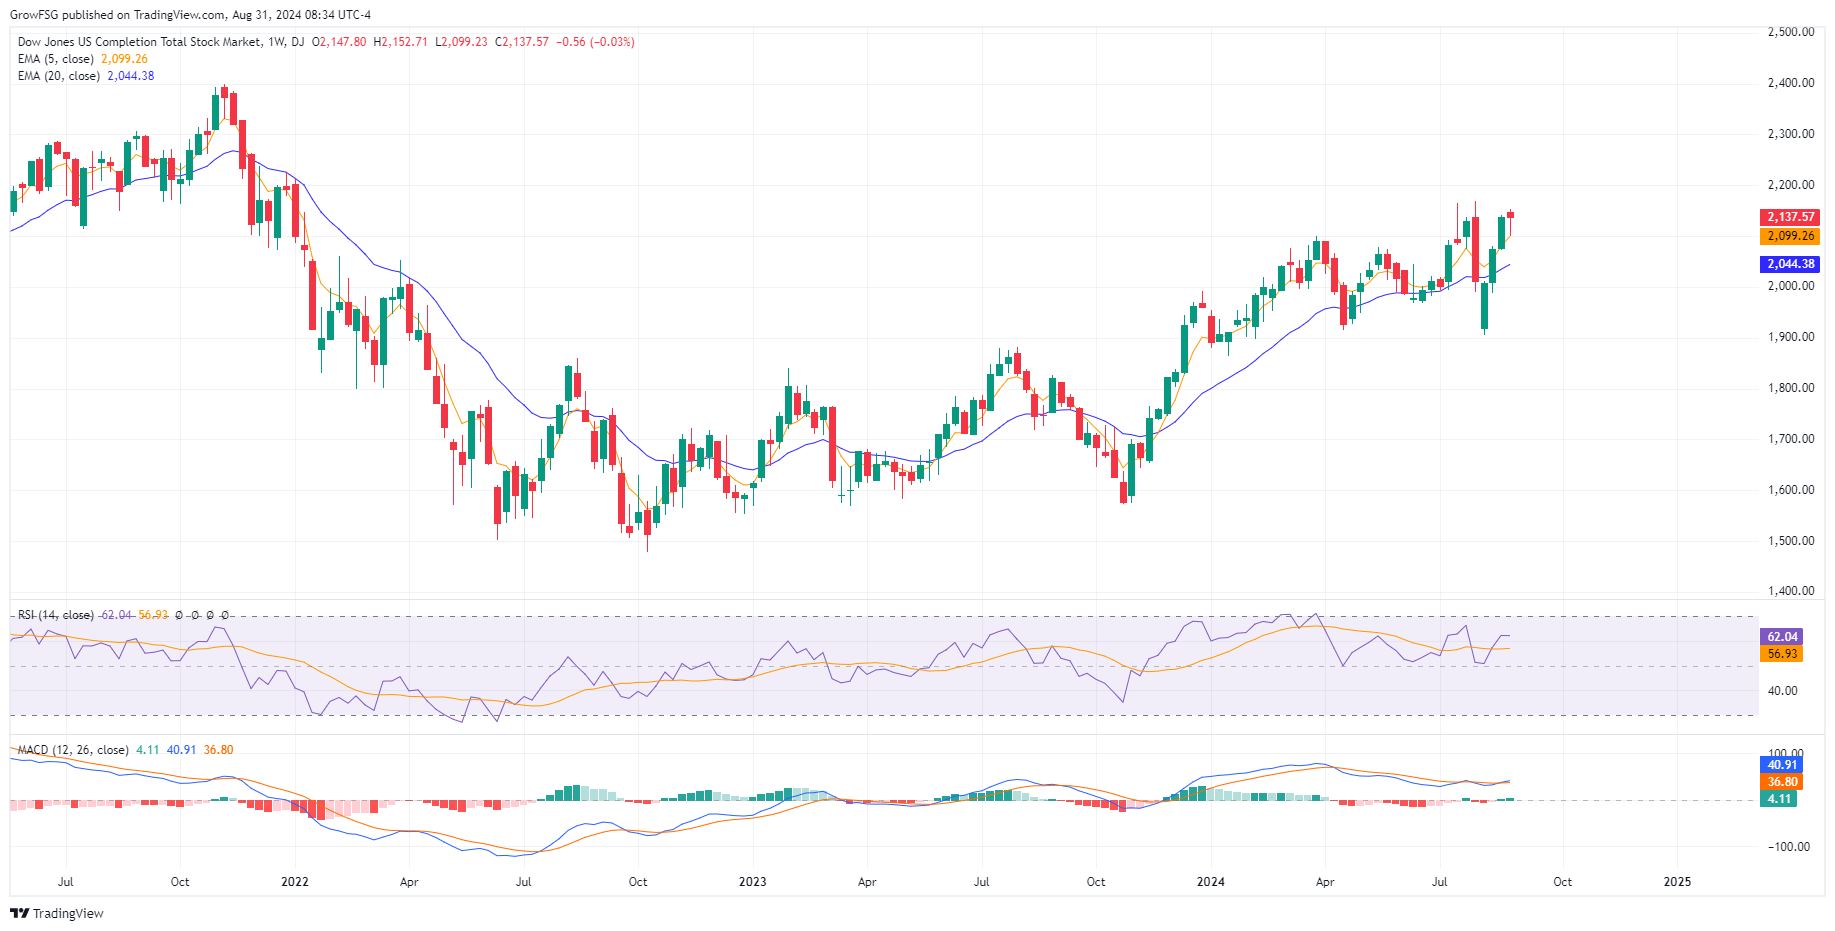
The S fund is beginning to stabilize above its 20WMA. Except for the outlier candle during the first week of August, the S fund has found support at the 20WMA and continues to find support at the 50 RSI line. At the same time, price has been trending up but basically sideways and MACD has been oscillating along the zero line. Bulls want to see an explosive move to the upside to really confirm this rally.
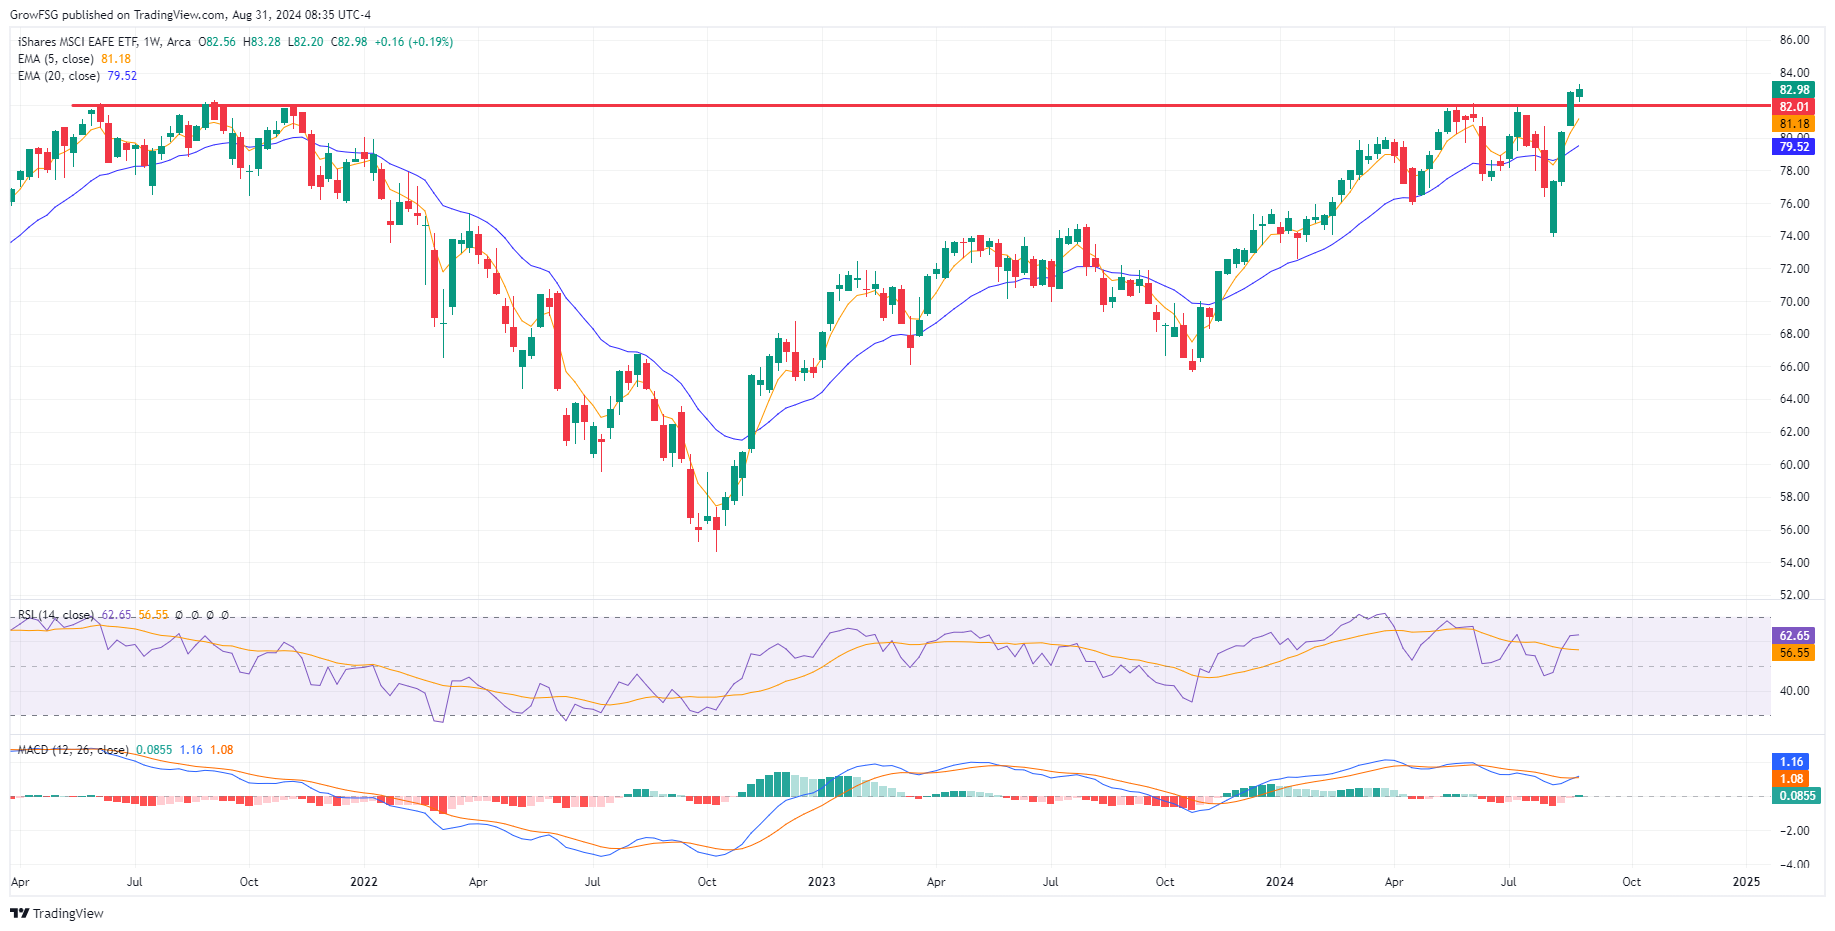
The I fund has seen very strong price action for the past 4 weeks. We now have 2 consecutive weekly closes above the 82 level. Ideally, 82 will now act as support on any pullback. The critical line in the sand for the I fund is the June low at 77.50. A close below that level means that the I fund rally has failed. For now, we need to respect price action and the new relative high in the I fund.
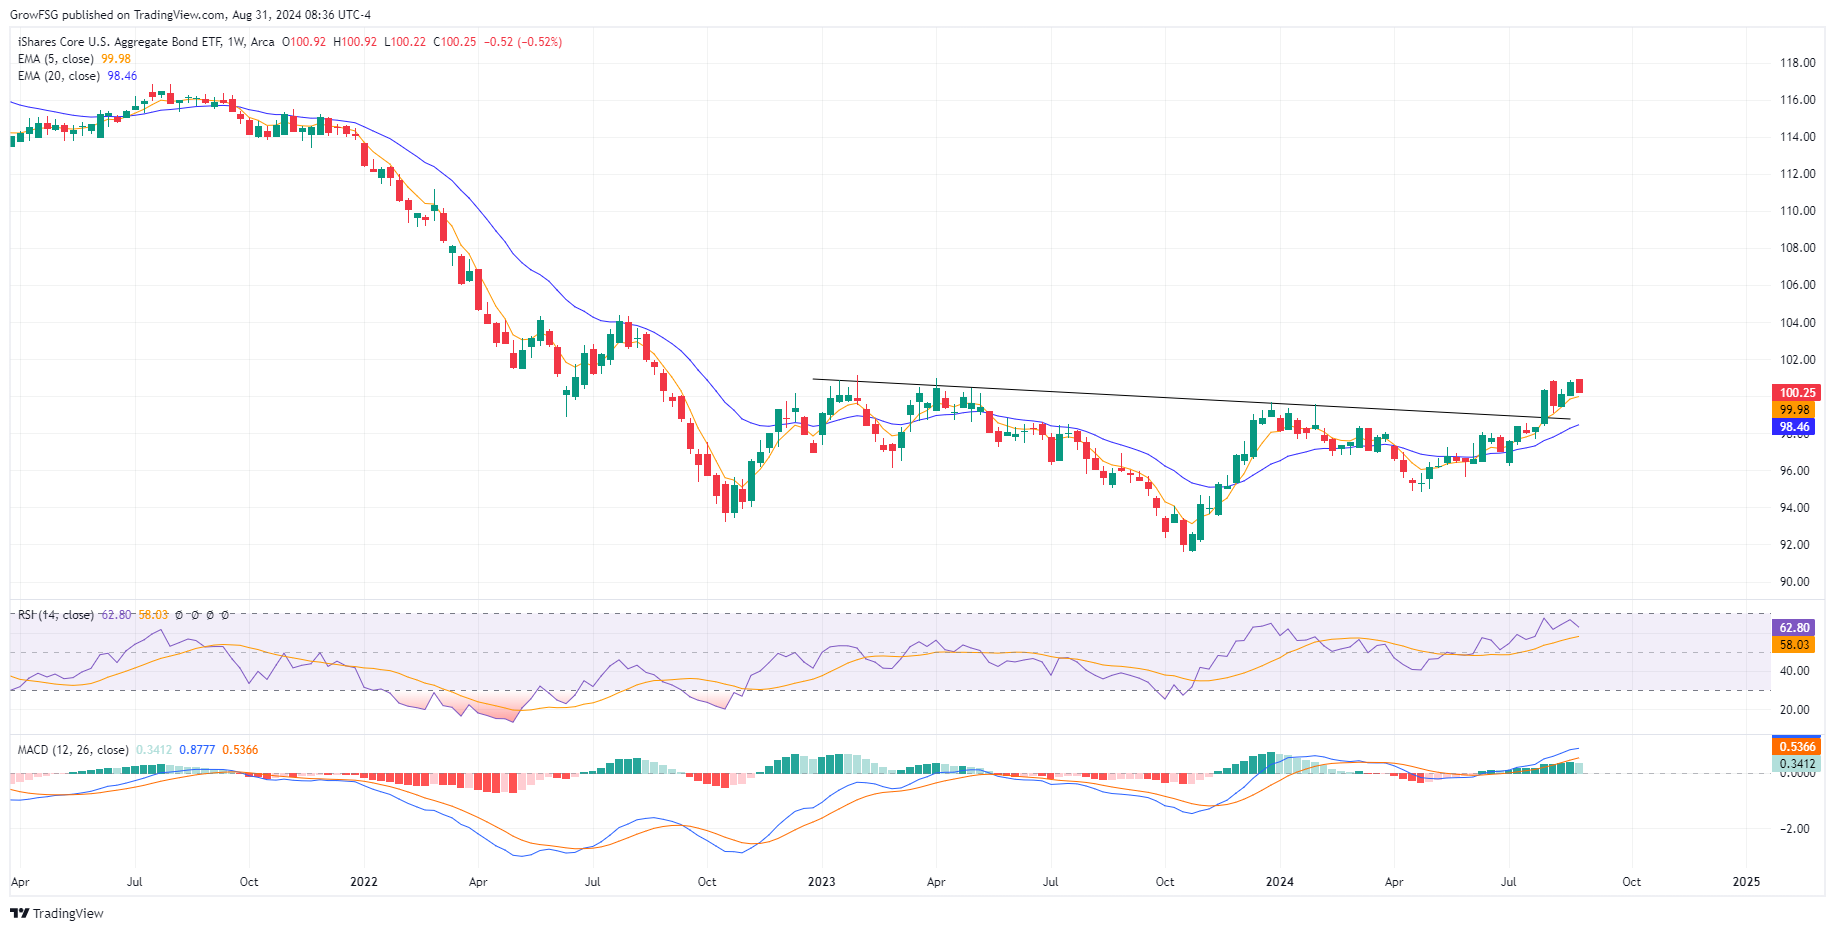
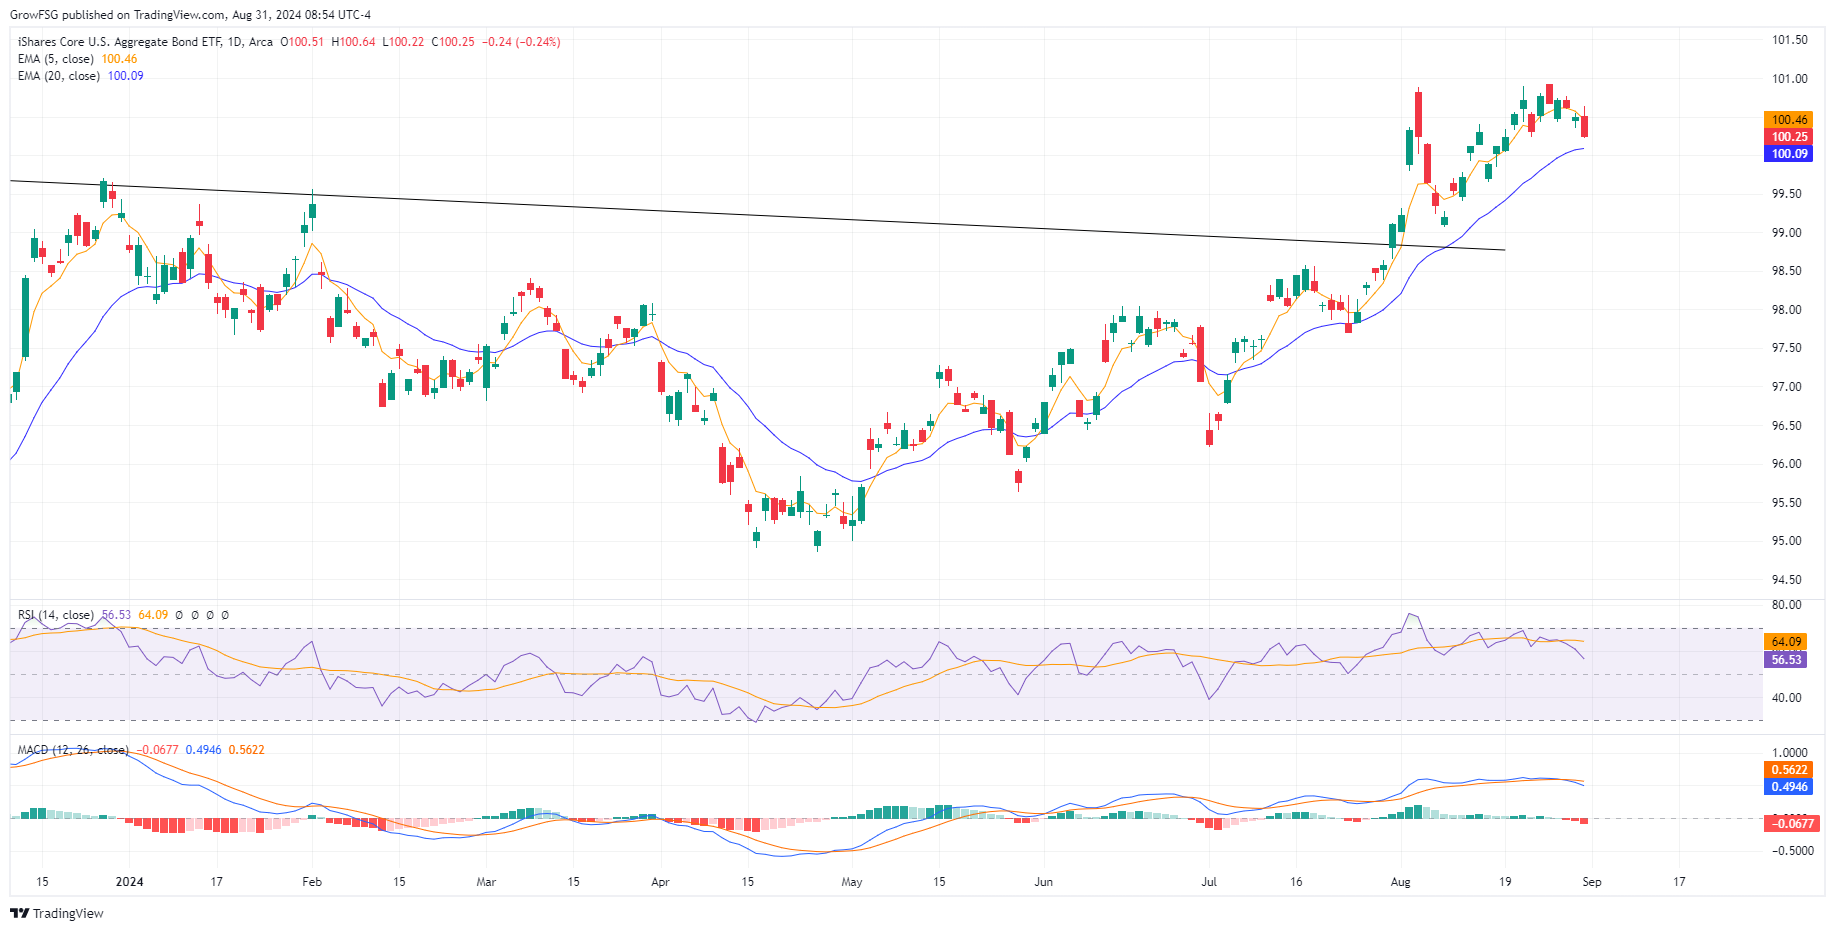
The F fund gave us a very clear breakout during the last week of July. Since then, price has been consolidating along a rising 5WMA line in yellow. While the chart pattern is excellent, it is possible for price to come back and retest the neckline and the rising 20WMA in blue before resuming its uptrend. If the F fund declines it means interest rates are moving higher. This would put downward pressure on the S fund rally as well.
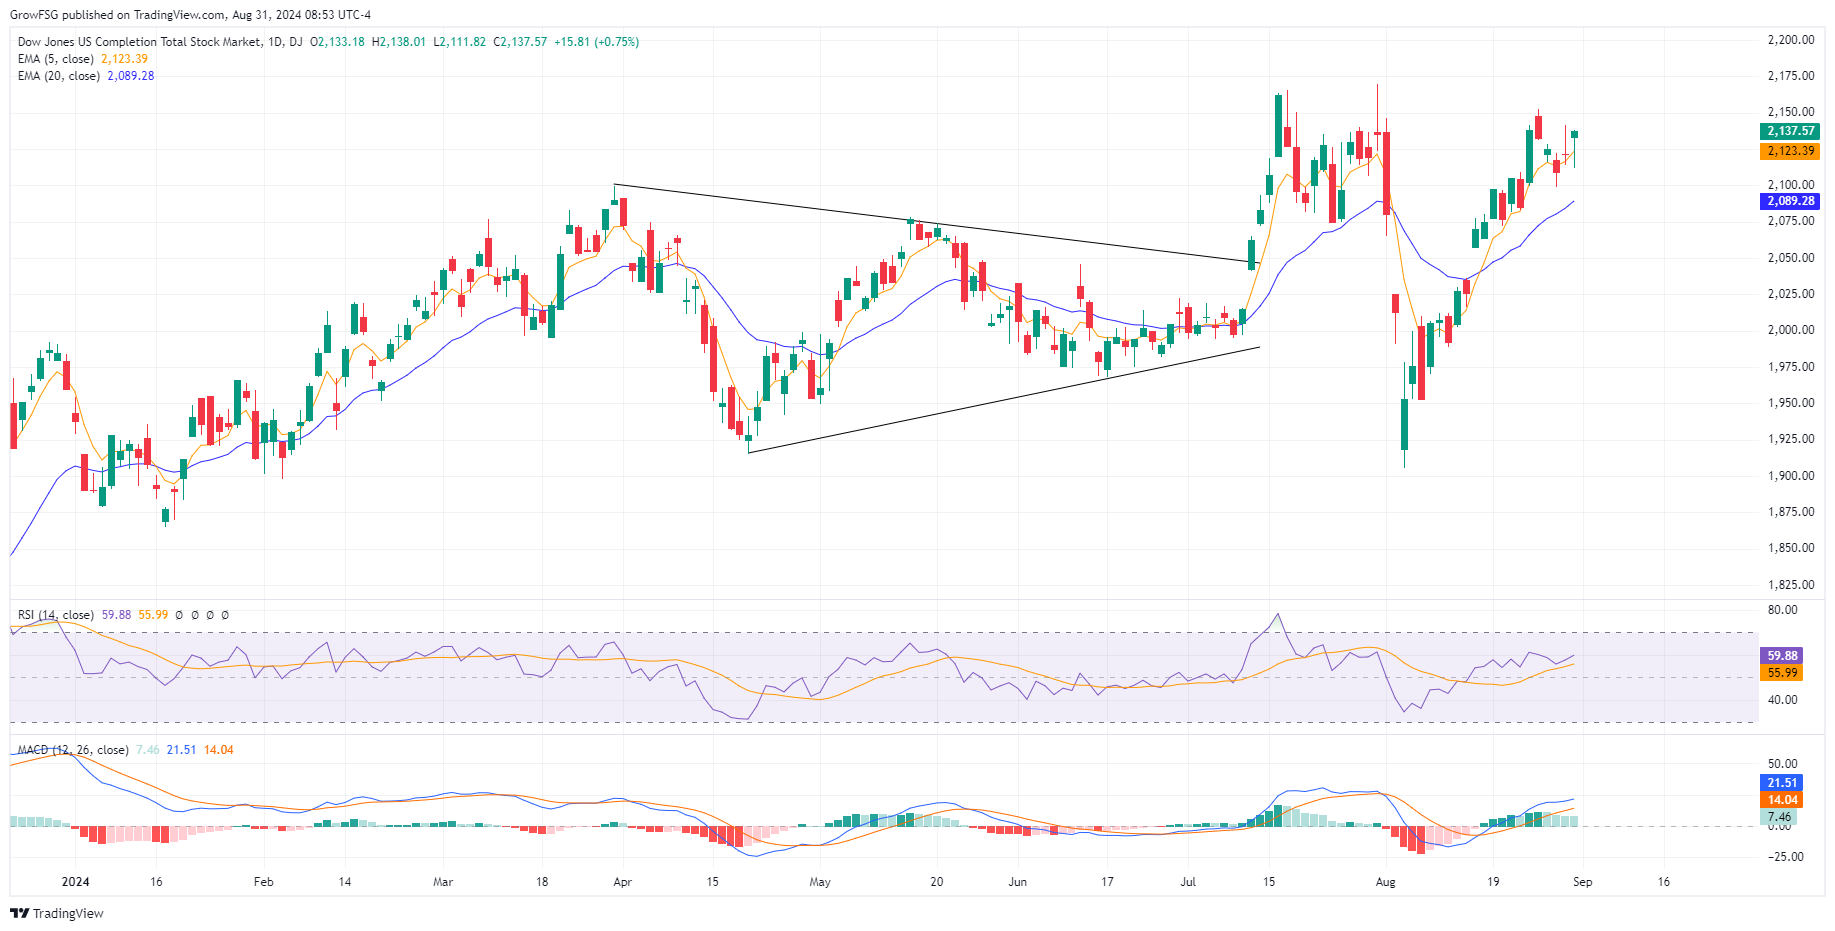
The S fund has been an unbelievable ride on a daily basis. We had a clear triangle pattern that formed over the course of 3 months. The powerful July breakout failed spectacularly in early August, only to recover with a V bottom. Essentially, the market took out the longs and the shorts. Anyone who bought the July breakout got killed in early August. Anyone who shorted the failed breakout got killed with the V bottom recovery. A continued rally in the S funds comes down to the direction of interest rates and unemployment. If interest rates do not come down and unemployment continues to accelerate, the rally in the S fund will not continue.
The I fund rally has been very strong off of the early August low. We can see the weakening at this point as RSI and MACD begin to stall. Ideally, we see an orderly pullback to the 82 level or the rising 20DMA line before a resumption of the uptrend. It really comes down to the direction of the Dollar.
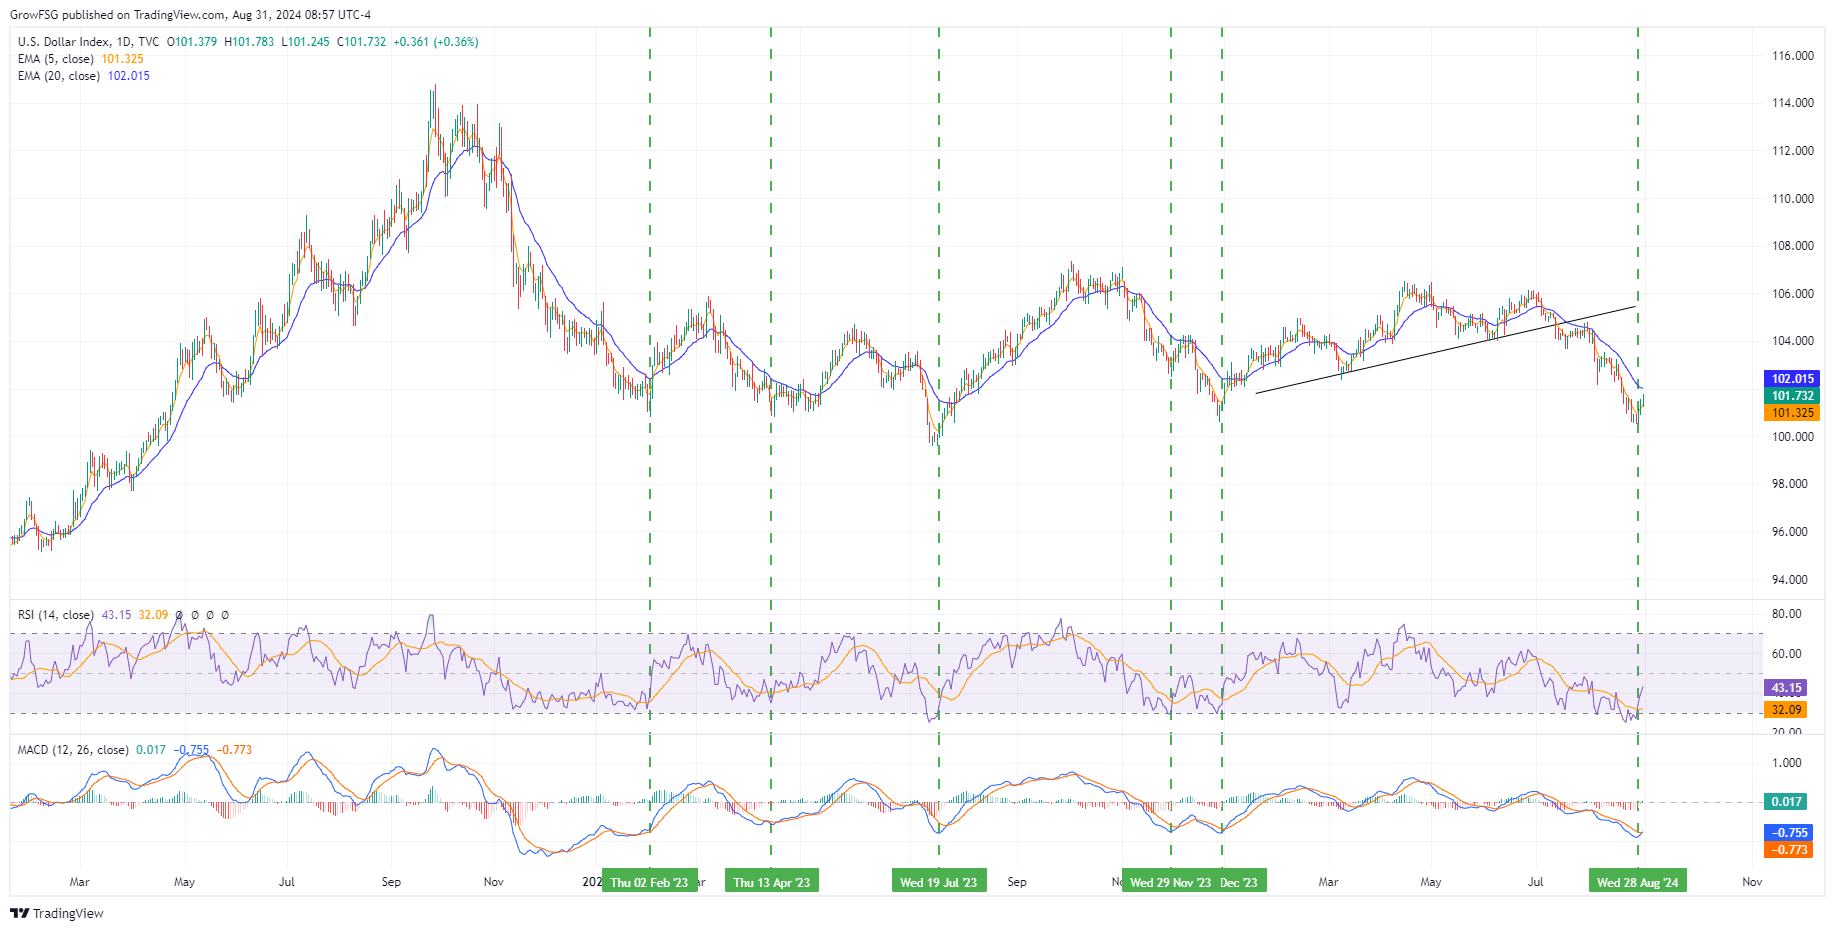
The chart below shows the U.S. Dollar going back to early 2021. There is a very strong inverse correlation between the price of the Dollar and the I fund. When the dollar is declining, the I fund is going up. When the dollar is strengthening, the I fund is going down. We had a breakdown through a relatively long term trendline in July which was very bullish for the I fund. The dollar has rallied for the past couple of days from levels that have represented a bottom over the past few years (green dotted lines). We also see RSI and MACD turning up from oversold levels. If the dollar has put in a low, the I fund is very likely to roll over from here.
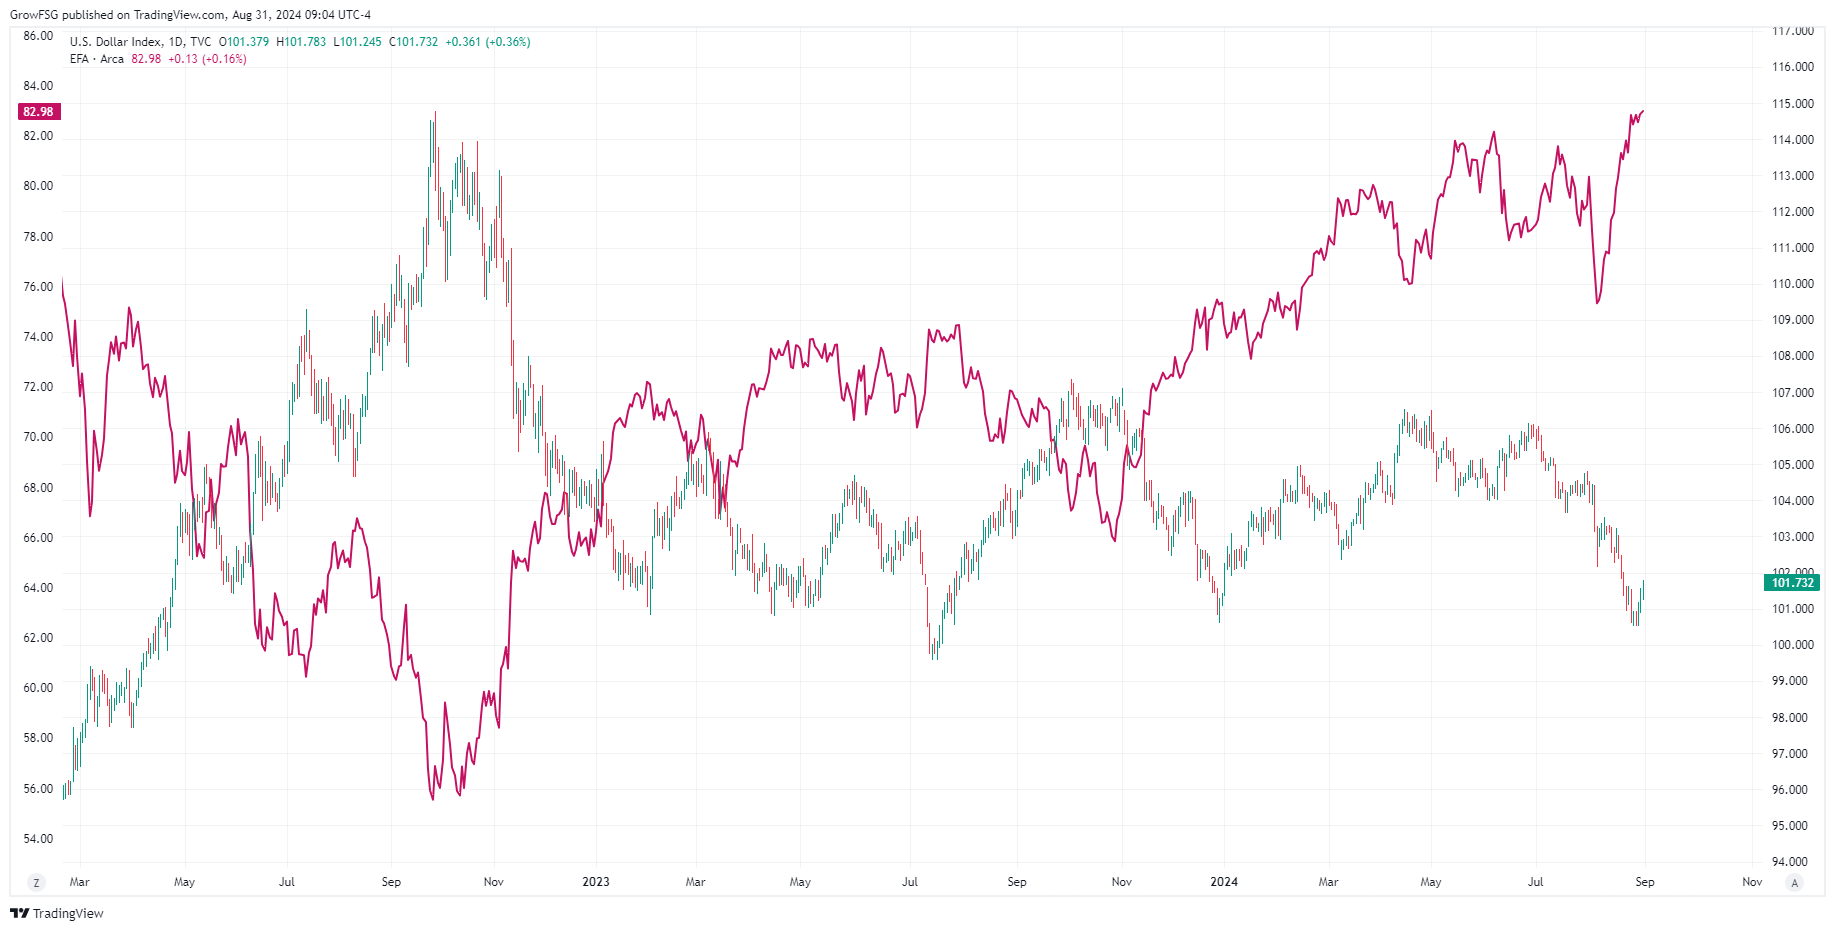
This is the same chart showing the dollar in candlesticks and the I fund in red. You can see the inverse correlation between the dollar and the I fund. While not an exact inverse correlation on a daily basis, a strengthening dollar is clearly a drag on the I fund.
The F fund broke out through the neckline in late July, came back and retested the line, and then continued higher. The rally has stalled with RSI rolling over and MACD turning negative on a daily basis. We expect to see the 20DMA and 50 RSI line act as support on this pullback. While it is hard to envision a scenario where the F fund corrects significantly from here, we will let price action be our guide. The price of the F fund moves inversely to interest rates. If the F fund moves lower, it means that interest rates are rising. We know that the FED is expected to begin a rate cutting cycle in September. All indications are that interest rates will come down. If they do not, the S fund rally will fail as it is dependent on the expectation of lower rates. The economy is in a very tenuous place. We need to let it play out and respond to price action.
September and October are the 2 most volatile months of the year. Over the past 10 years, the S&P500 has DECLINED 2.4% on average during the month of September. Election years are notoriously negative during September and October BUT, there are exceptions. Is it possible that 2024 will be an exception? Absolutely. We need to watch price action and respond to what is actually happening rather than getting sucked into one narrative or the other.
It's going to be an exciting month! Now is NOT the time to take your eye off the ball...
Have a great week!
The Grow My TSP Team
Market sentiment can be measured in a number of ways. Three simple but valuable metrics are the Put/Call Ratio, the VIX, and the CNN Fear & Greed Index. On Friday, the Put/Call ratio fell along with the VIX. The Fear & Greed index closed the day at 63 with plenty of room to move higher before showing an overbought level. The combination of Friday's price action, volume of shares traded, and the sentiment indicators is telling us that the market wants to move higher. While there are plenty of macro-economic, geopolitical, and seasonal concerns, our focus needs to be on price action and what is actually happening now.
In this Newsletter, we'll take a look at the current trend from a top down approach. We'll look at monthly, weekly, and daily charts to determine the trend on different timeframes and identify important areas of support and potential resistance.
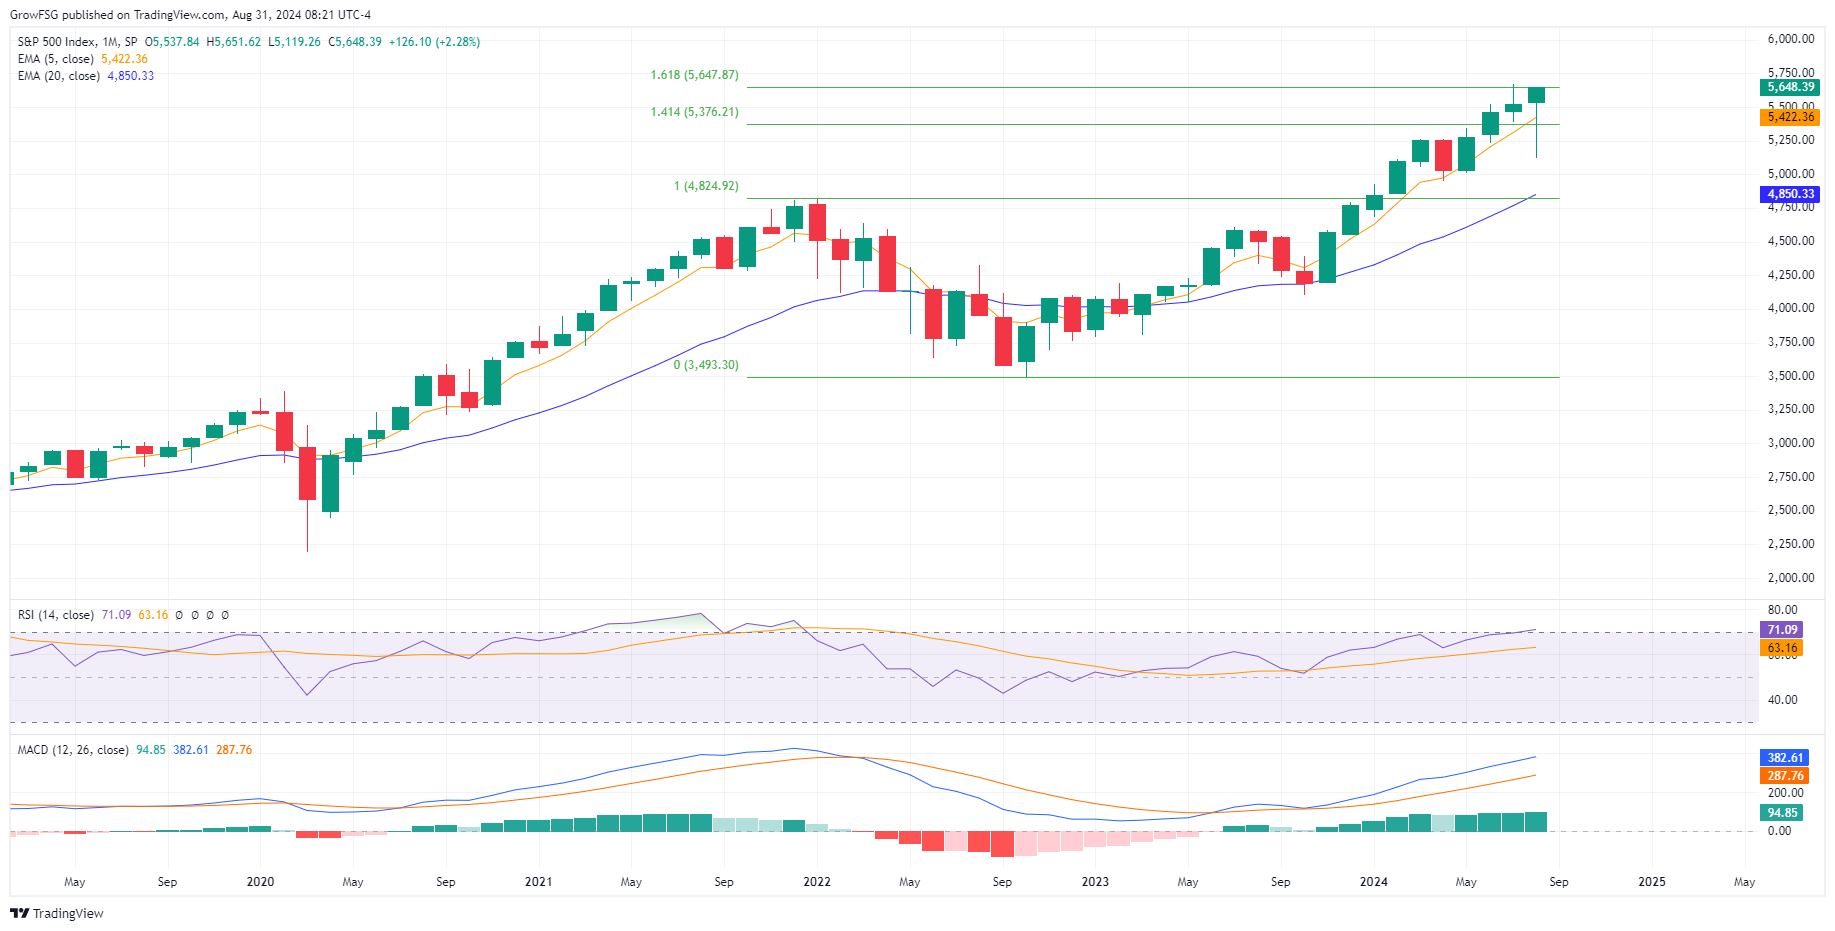
Monthly
Friday was the last trading day of August, giving us an opportunity to study the very long term, monthly candlestick charts over a long 3 day weekend. The monthly candle charts show us the very long term trend. For the C fund, the trend is clearly up. August closed at a new all-time high with a very bullish hammer pattern. While we saw significant weakness early in the month, buyers stepped in and bought the dip. Price has not been able to clear the Fibonacci 1.618 extension level. Until this level is taken out, there is some reason for concern. On the other hand, we can see the value of the 5 month moving average line (yellow). As long as price stays above this line, the rally is clearly in place. We also see RSI and MACD continuing to expand to the upside. On a monthly basis, the trend in the S&P500 is very strong.The S fund is still well off its all-time high set back in late 2021. While the S fund has been lagging the C fund since 2021, the bulls are hopeful that lower interest rates will result in S fund outperformance going forward. This can be seen in the August hammer. The S fund fell all the way down to its 20 MMA (Month Moving Average) before recovering all the way back to where it opened the month. Like the C fund, this is very bullish price action.
The I fund finally closed a month above the 82 level. This has been resistance since mid-2021. While it was an extremely volatile month for the I fund, this closing price is significant. With RSI having room to move higher and MACD expanding to the upside, the I fund is looking very strong on a monthly basis.
The rally in the F fund continued this month as the 5 month moving average is about to cross above the 20 month moving average. This is a very bullish cross that we have not seen since mid-2019. We now have a clear uptrend on a monthly basis with a higher low and a higher high. RSI just broke through 50 and MACD is expanding, giving the F fund plenty of room for gains before becoming overvalued.
Weekly
The very long term trend (monthly) is positive for all 4 TSP funds. While the monthly charts are not effective for timing reallocation decisions, we should generally give the benefit of the doubt to the bulls as investors are in a long-term buy the dip mentality. The weekly charts are much more useful in terms of reallocation decisions.The weekly chart of the C fund shows price hitting resistance at the 1.618 extension. It has hit this level 4 times on a weekly basis. The 1.618 Fibonacci extension level is important as it is the most common level for a major trend reversal. When we don't see a reversal at this level, it is telling us that the uptrend is very strong and likely to continue. Bulls want to see RSI and MACD expand to the upside at the 1.618 level is taken out. This would show strong momentum for the continued rally. We aren't really seeing that right now but, we do not yet have confirmed divergence either. Going into the 2022 top, we see confirmed divergence between price and RSI. IF price continues higher but RSI rolls over, this will be a very big red flag.
The S fund is beginning to stabilize above its 20WMA. Except for the outlier candle during the first week of August, the S fund has found support at the 20WMA and continues to find support at the 50 RSI line. At the same time, price has been trending up but basically sideways and MACD has been oscillating along the zero line. Bulls want to see an explosive move to the upside to really confirm this rally.
The I fund has seen very strong price action for the past 4 weeks. We now have 2 consecutive weekly closes above the 82 level. Ideally, 82 will now act as support on any pullback. The critical line in the sand for the I fund is the June low at 77.50. A close below that level means that the I fund rally has failed. For now, we need to respect price action and the new relative high in the I fund.
The F fund gave us a very clear breakout during the last week of July. Since then, price has been consolidating along a rising 5WMA line in yellow. While the chart pattern is excellent, it is possible for price to come back and retest the neckline and the rising 20WMA in blue before resuming its uptrend. If the F fund declines it means interest rates are moving higher. This would put downward pressure on the S fund rally as well.
Daily
The S&P500 (C fund) has been in a sideways consolidation for the past 10 trading days. Friday's strong green day pushed price back to the top of the range, just below resistance at the 1.618. A strong close above this level would be extremely bullish for the market and would generate a reallocation in the Grow Model Portfolio. On a daily basis, this is a very bullish chart with RSI finding support at its rising trendline and MACD resuming an upside expansion. A strong breakout next week would defy the historically seasonal trend but we need to focus on price action.The S fund has been an unbelievable ride on a daily basis. We had a clear triangle pattern that formed over the course of 3 months. The powerful July breakout failed spectacularly in early August, only to recover with a V bottom. Essentially, the market took out the longs and the shorts. Anyone who bought the July breakout got killed in early August. Anyone who shorted the failed breakout got killed with the V bottom recovery. A continued rally in the S funds comes down to the direction of interest rates and unemployment. If interest rates do not come down and unemployment continues to accelerate, the rally in the S fund will not continue.
The I fund rally has been very strong off of the early August low. We can see the weakening at this point as RSI and MACD begin to stall. Ideally, we see an orderly pullback to the 82 level or the rising 20DMA line before a resumption of the uptrend. It really comes down to the direction of the Dollar.
The chart below shows the U.S. Dollar going back to early 2021. There is a very strong inverse correlation between the price of the Dollar and the I fund. When the dollar is declining, the I fund is going up. When the dollar is strengthening, the I fund is going down. We had a breakdown through a relatively long term trendline in July which was very bullish for the I fund. The dollar has rallied for the past couple of days from levels that have represented a bottom over the past few years (green dotted lines). We also see RSI and MACD turning up from oversold levels. If the dollar has put in a low, the I fund is very likely to roll over from here.
This is the same chart showing the dollar in candlesticks and the I fund in red. You can see the inverse correlation between the dollar and the I fund. While not an exact inverse correlation on a daily basis, a strengthening dollar is clearly a drag on the I fund.
The F fund broke out through the neckline in late July, came back and retested the line, and then continued higher. The rally has stalled with RSI rolling over and MACD turning negative on a daily basis. We expect to see the 20DMA and 50 RSI line act as support on this pullback. While it is hard to envision a scenario where the F fund corrects significantly from here, we will let price action be our guide. The price of the F fund moves inversely to interest rates. If the F fund moves lower, it means that interest rates are rising. We know that the FED is expected to begin a rate cutting cycle in September. All indications are that interest rates will come down. If they do not, the S fund rally will fail as it is dependent on the expectation of lower rates. The economy is in a very tenuous place. We need to let it play out and respond to price action.
Bottom Line
The monthly charts are clearly bullish, meaning the long-term uptrend is firmly in place for all 4 TSP funds. The weekly charts of the stock funds are also bullish with strong bullish hammer patterns on the C and S funds, and the I fund breaking through resistance at 82. The daily charts are a bit more problematic with the C fund hitting resistance at the 1.618 extension level, the S fund still in the trading range, the I fund weakening, and the F fund potentially rolling over.September and October are the 2 most volatile months of the year. Over the past 10 years, the S&P500 has DECLINED 2.4% on average during the month of September. Election years are notoriously negative during September and October BUT, there are exceptions. Is it possible that 2024 will be an exception? Absolutely. We need to watch price action and respond to what is actually happening rather than getting sucked into one narrative or the other.
It's going to be an exciting month! Now is NOT the time to take your eye off the ball...
Have a great week!
The Grow My TSP Team
RELATED READS

Copyright Grow Investments, LLC | GrowMyTSP.com
Thrift Savings Plan Disclaimer
Neither growmytsp.com nor any of its partners or representatives is in any way affiliated with the United States Government, The Federal Retirement Thrift Investment Board (FRTIB.gov) or the Thrift Savings Plan (TSP.gov), and any service being offered is not sanctioned by the United States Government, the Federal Retirement Thrift Investment Board or the Thrift Savings Plan.