
Risk Management In TSP
The vast majority of TSP investors fall into one of two camps.
The first is absolutely risk averse from the beginning. This group has likely never touched their TSP account. For anyone entering government service prior to September 2015, the default was the G fund. Their contributions to TSP each payday are 100% free of market risk, but grow at the very low G fund rate of return. For anyone entering government service after September 2015, the default is the age appropriate L fund.
The second is some combination of 100% C and S funds. Regardless of market ups and downs, these TSP investors are committed to being fully invested.
There is nothing wrong with either TSP investing philosophy. We all have our own personal circumstances and risk tolerance. The question is, is there a happy medium to being 100% risk off or 100% risk on? Does it make sense to invest the same way throughout your career? Is there a way to capture the majority of market gains over time while avoiding the major market down turns?
At Grow My TSP, we educate our subscribers in using technical analysis of price action to manage risk. In this post, we will discuss a simple tool, over two timeframes, that TSP investors can use to manage risk during all market environments.
The 50 Period Moving Average Line
The market does not move up or down in a straight line, it moves in waves. During a bull market, price makes new highs, corrects, and continues on to higher highs. During a bear market, price falls, corrects, and rolls over again to lower lows. This wave pattern can be seen across every time frame.
A simple moving average line smooths out the extreme highs and lows, enabling investors to see the overall trend. As long as price remains above the moving average line, the trend is up. A close below the moving average line indicates a potential change in the trend.
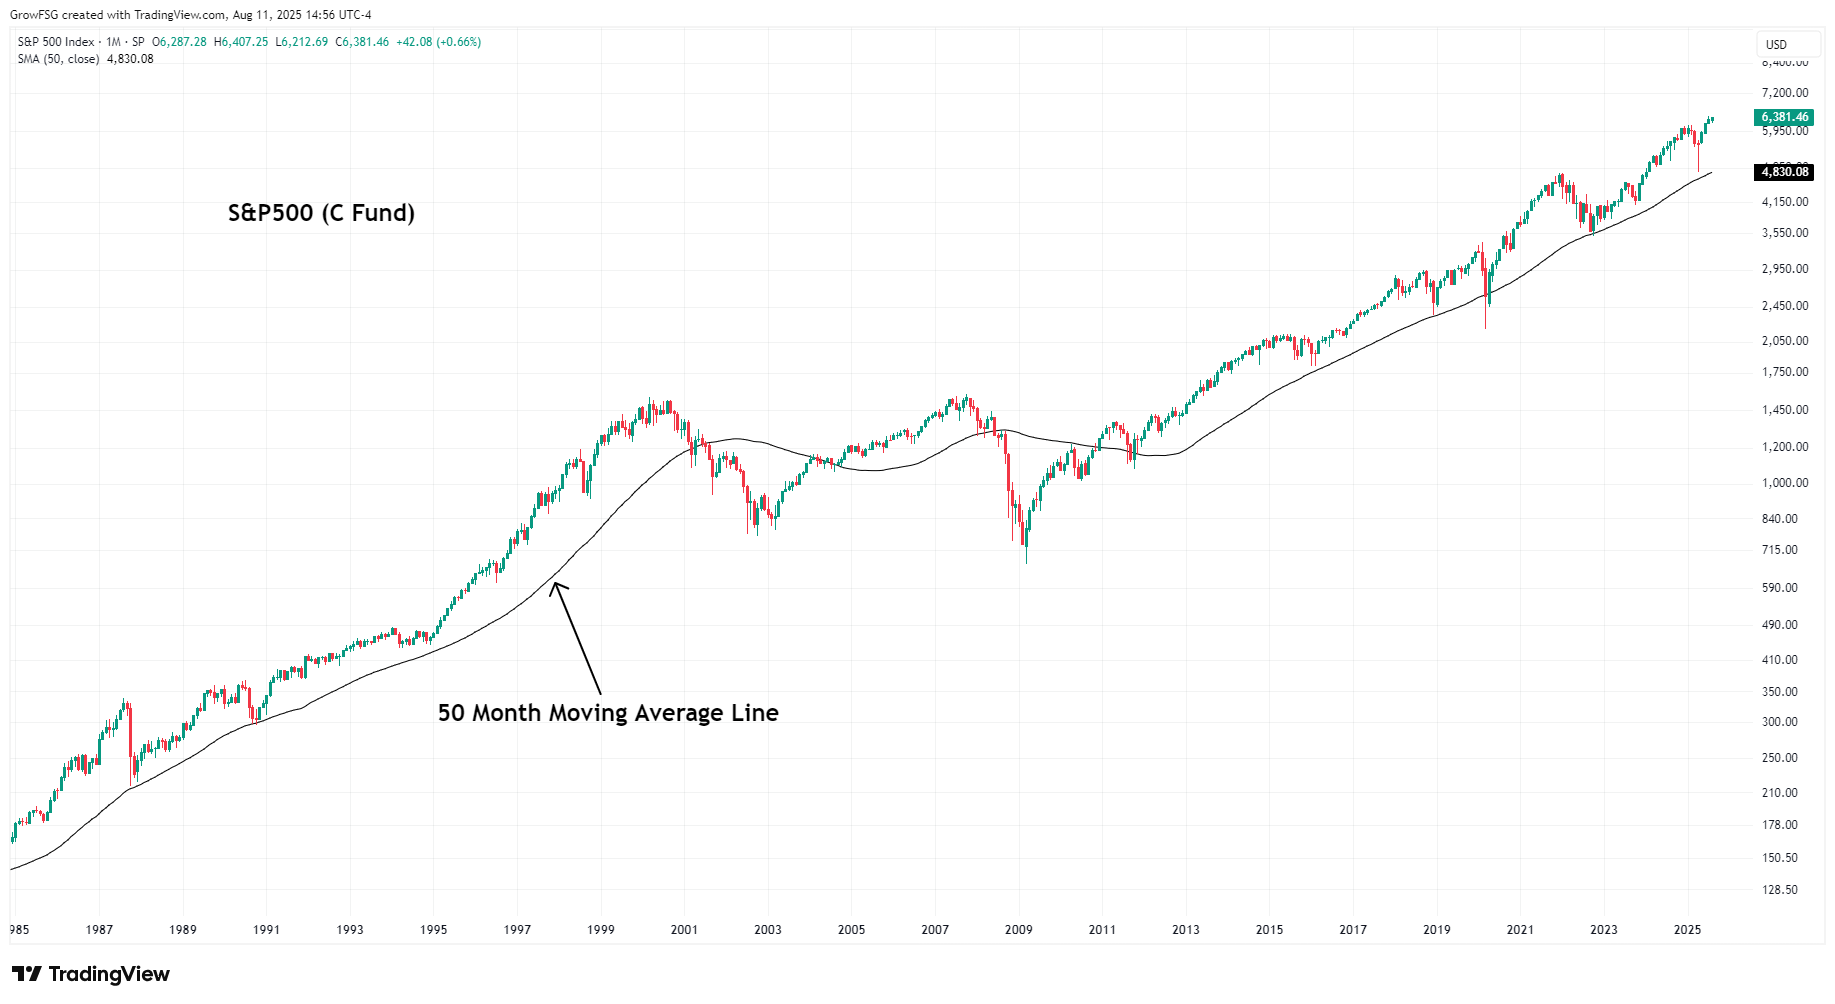
The monthly chart of the S&P500 (our C fund) shows that the long-term trend has been up since 1985. The 50 month moving average (MMA) line has provided critical support and defined this trend throughout the time period. Each time price has corrected during this decades long bull market, it has found support at the 50MMA line EXCEPT during March 2001 and June 2008.
The 50MMA has provided critical support, and a great buying opportunity, for decades. It has also been a valuable "line in the sand".
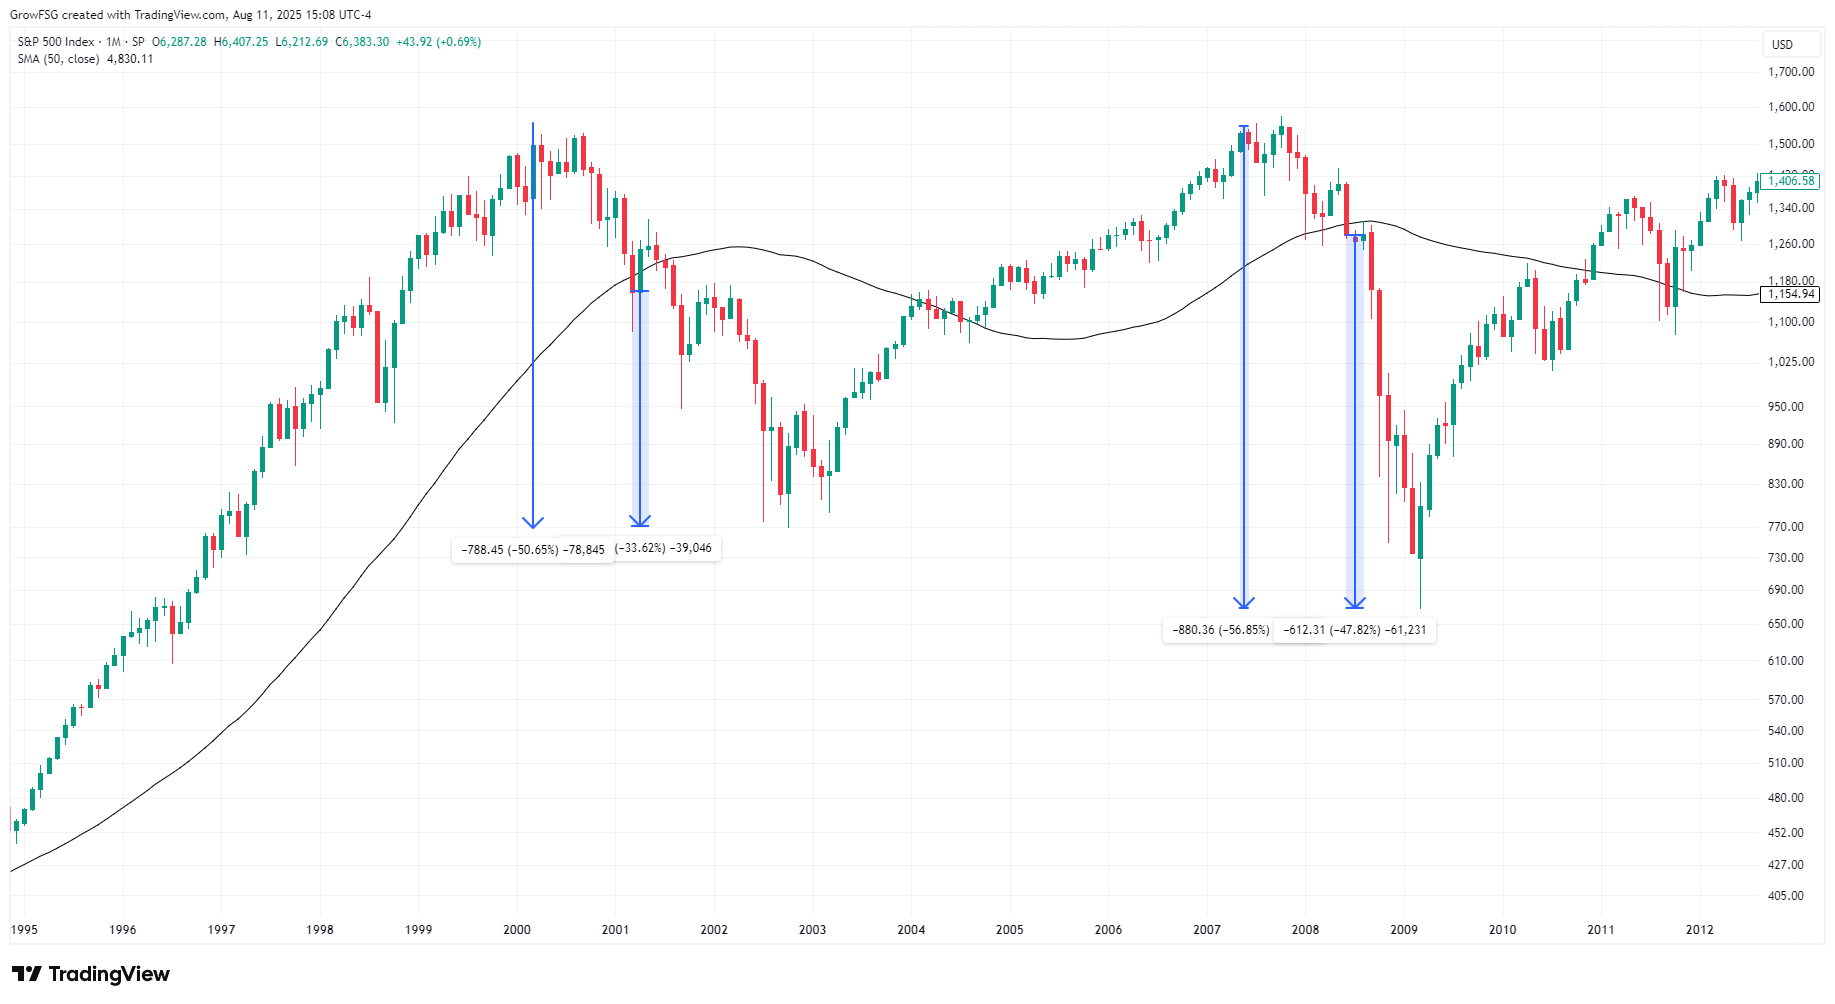
Many of us have experienced two significant bear markets during our careers; 2000-2003 and 2007-2009.
During the 2000 to 2003 bear market, the S&P500 lost 50% of its value. It lost 33% of its value after a monthly close below its 50MMA. During the 2007-2009 bear market, the S&P500 lost 57% of its value and 48% after a monthly close below its 50MMA.
These are the major declines that we want to avoid as TSP investors. Regardless of your age or proximity to retirement, these types of declines can destroy your retirement nest egg or set your savings back for years.
While it is not possible to anticipate the exact tops and bottoms of the market, it is possible to manage downside risk. For long-term TSP investors, the 50MMA is a great tool to help us do it.
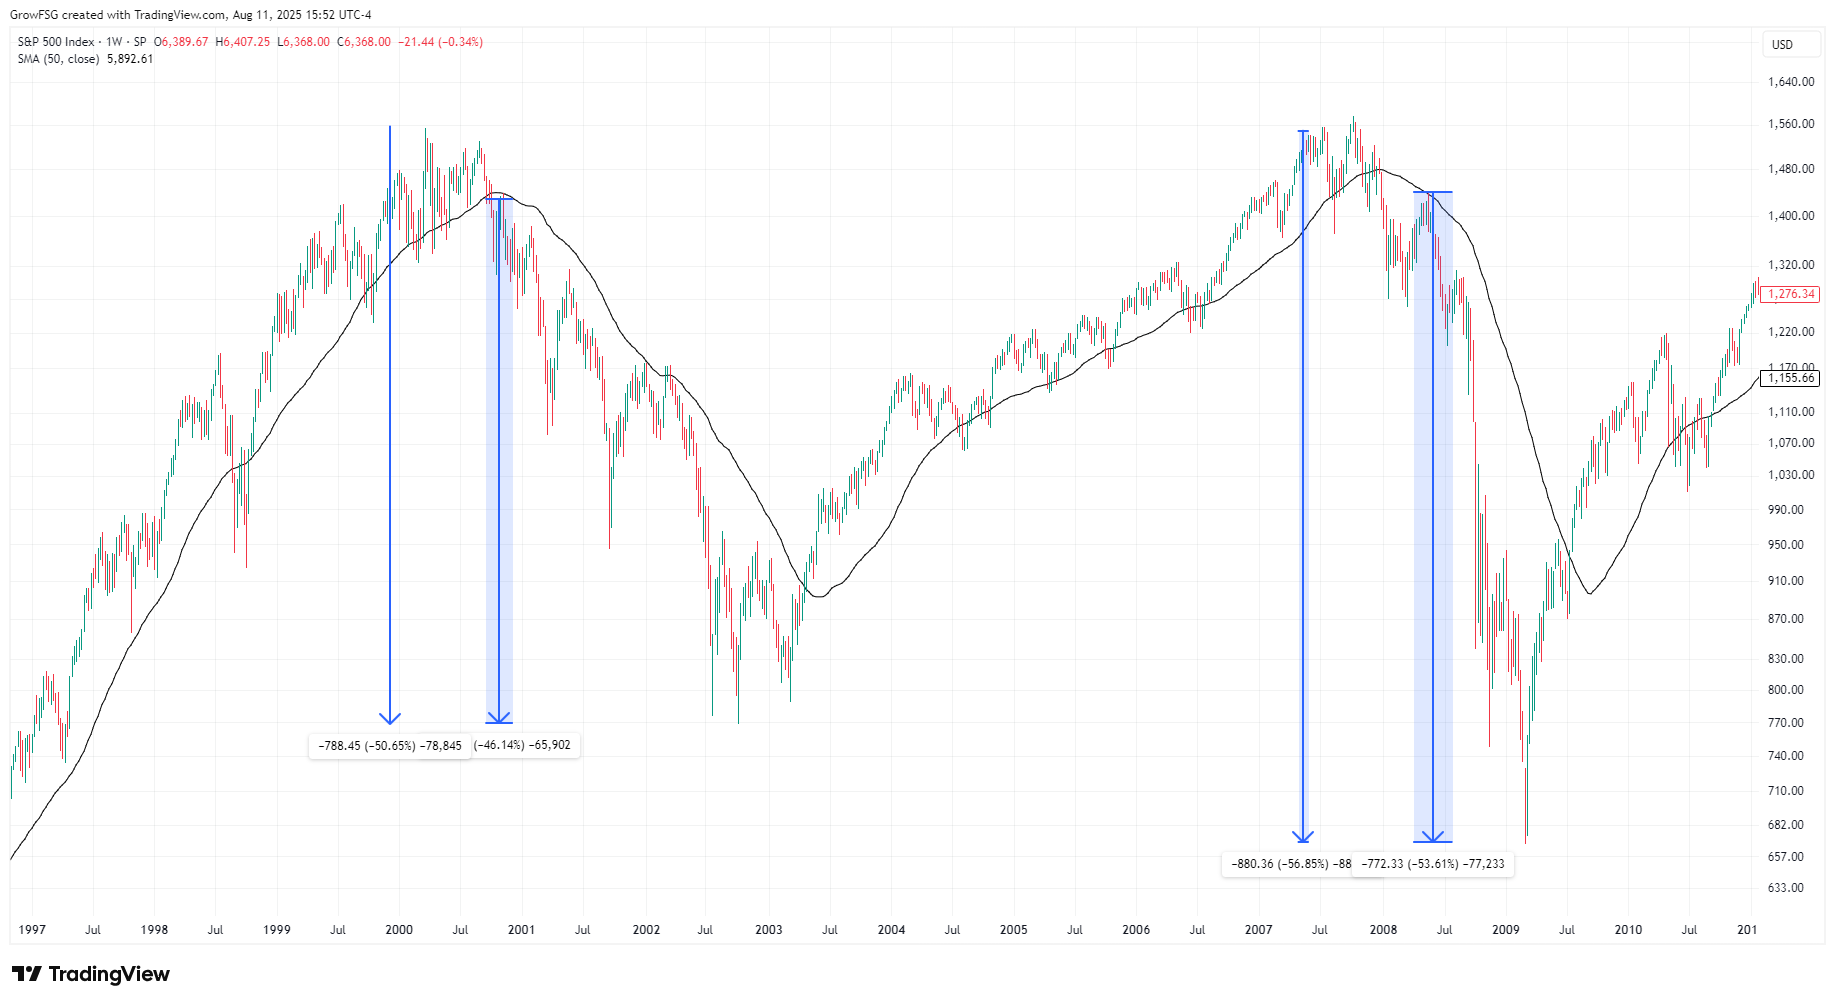
The next chart utilizes the same concept but on a weekly timeframe. Decreasing the timeframe from monthly to weekly requires more focus on the part of TSP investors, and can produce more false signals, but the payoff can be drastically improved risk management.
The chart below is a weekly view of the chart above. Each candle is one week of price movement and the black line is now the 50 Week Moving Average (WMA). While there are more frequent overshoots, the 50WMA clearly acts as support during the bull phases and resistance during the bear phases.
By using a weekly timeframe, TSP investors could have managed risk much closer to the actual market top in 2000 and 2008.
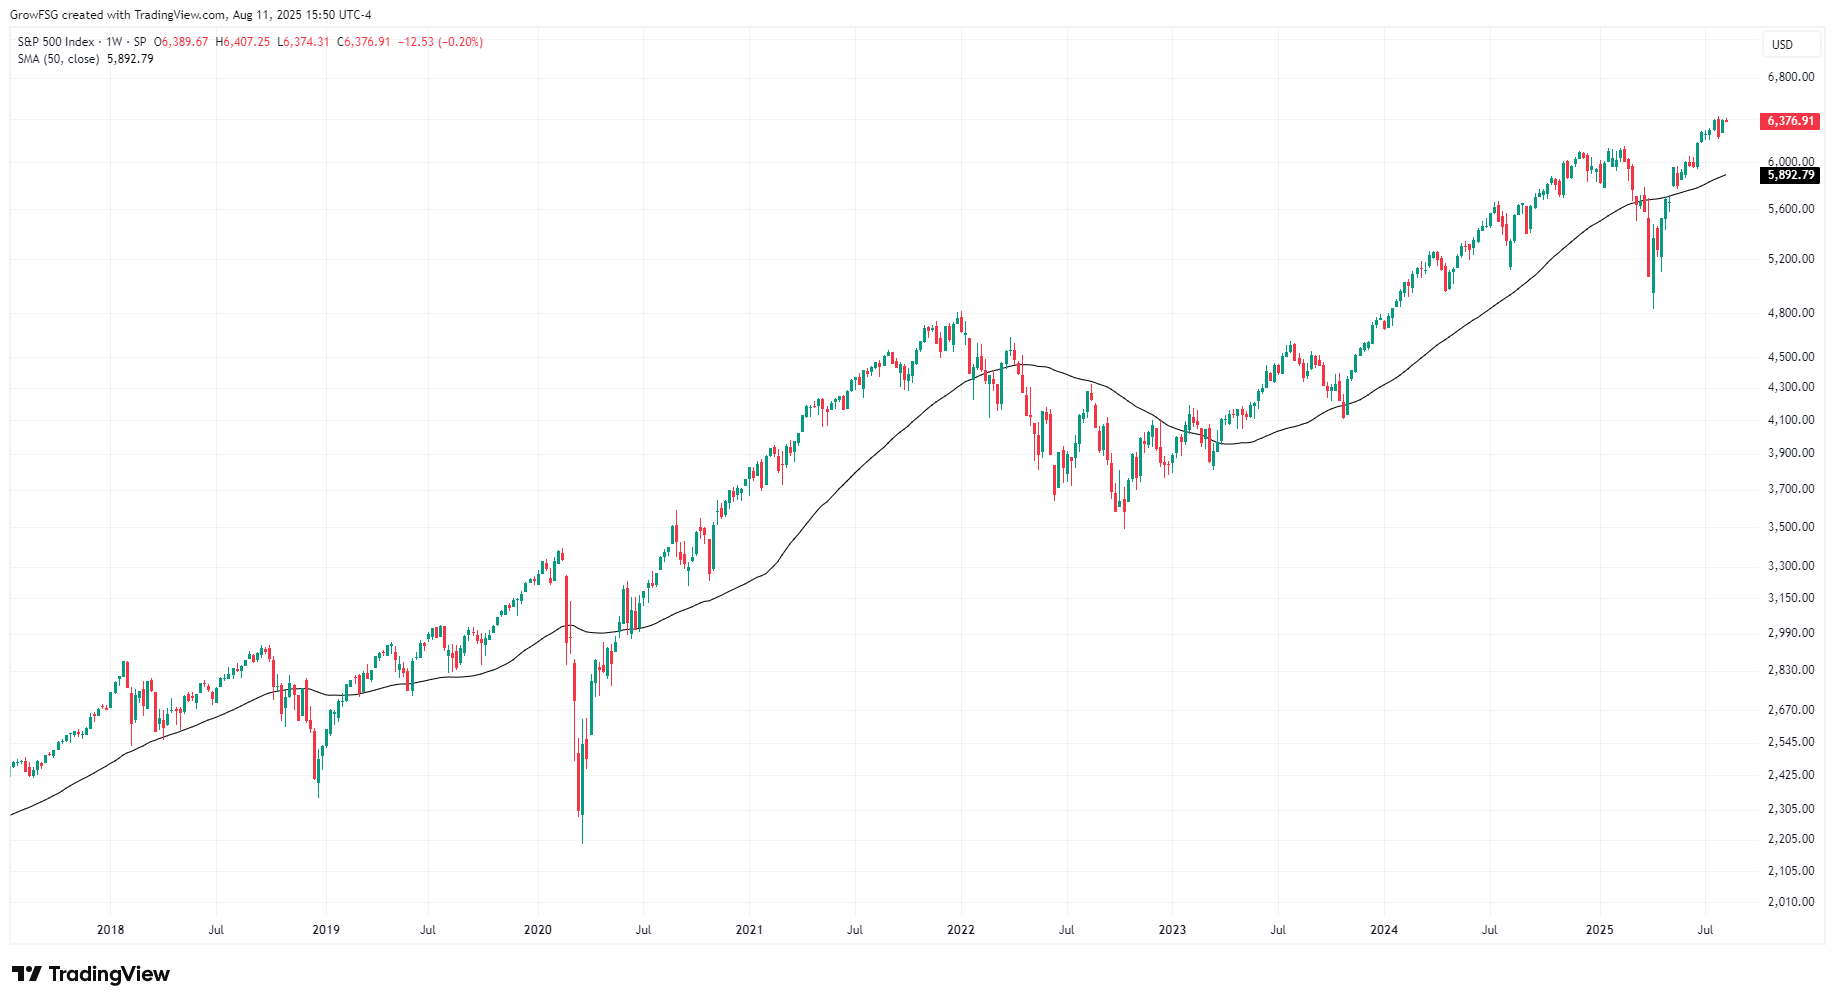
Looking at a more recent time period, the value of the 50WMA is clear in the weekly chart of the S&P500 below.
TSP investors who utilized the 50WA to guide their reallocation decisions could have avoided the majority of the drawdowns in 2018, 2020, 2022, and 2025, while capturing the majority of gains over that time period.
Bottom Line
The 50 period moving average line is a great tool to help smooth out price extremes. It can help to keep TSP investors in the stock funds when the market trend is up, and protecting those gains when the market trend is down.
The 50 period moving average works equally well on a yearly, monthly, weekly or daily chart. Each investor needs to decide which timeframe works best for their personal circumstances, risk tolerance, and time commitment.
This is a tool that can be used throughout your career and in any market environment. For the ultra risk averse, the 50 period moving average can be enough of a guiderail to give them the confidence to dip a toe into the stock funds. For the "fully invested at all times" camp, it can be a final warning and help them avoid catastrophic market drawdowns.
The 50 period moving average is one of many tools we utilize in our analysis and teach in our courses, Newsletters, and Podcasts. To learn more, sign up at GrowMyTSP.com!
-----------------------------------------
GrowMyTSP.com does not provide personal investment advice. We are an education and analysis service, helping TSP investors grow their accounts using strategies and models that best fit their personal circumstances and risk tolerance. Get started at GrowMyTSP.com.
