
Managing Risk In TSP
2026 has been a challenging year for the S&P500 (our C fund). After peaking in early January, the S&P500 had been in a slow decline. As of early March, price was at the same level it was in October of last year. That's almost 5 months of no gains!
There is a war raging in Iran, the continuing conflict in Ukraine, and military operations in Central America. We have an out of control national debt, a contentious mid-term election coming up, a new Federal Reserve Chairman taking the helm in May. TSP investors are understandably getting nervous.
How can we, as TSP investors, manage this risk?
All the conditions listed above, and many more, have an impact on the daily ups and downs of the market. While we can't manage geopolitical and socio-economic risks, we can manage Market Risk.
"You have to say to yourself, “If I’m right, how much am I going to make? If I’m wrong, how much am I going to lose?” That’s the risk/reward ratio." - Peter Lynch
No one has a crystal ball and no one can time market tops and bottoms. What we can do is identify trend changes and respond accordingly. We can think in terms of a risk/reward ratio. We can look at a price chart and determine the potential upside in the stock funds vs the potential downside.
In this post, we will look at the 4 key elements to effectively manage downside risk in your TSP account. We'll also look at a price chart of the S&P500 to show you exactly how to do it.
Using technical analysis to manage downside risk in your TSP account is less about predicting the market perfectly and more about identifying when risk is increasing so you can protect capital. Because the TSP only allows two reallocations per month, the goal is to use higher-probability signals that help you avoid major drawdowns, not frequent trading.
Utilizing weekly charts will keep you invested in the stock funds during short pullbacks AND identify significant trend changes that require action.
The first step is to determine whether the market is in an uptrend or downtrend.
Below is a weekly chart of the S&P500, where each green or red rectangle is one week of price action. The blue line is the 20 Week Moving Average (WMA). This chart shows 7 distinct trends since 2019, including 4 uptrends and three downtrends.
The 20WMA line smooths out the weekly ups and downs, allowing us to clearly see the distinct trends of price.
An example of risk management using trend analysis might be to allocate to the stock funds during strong uptrends, reduce stock fund exposure when the trend is weakening, and allocating to the G fund when the trend is down.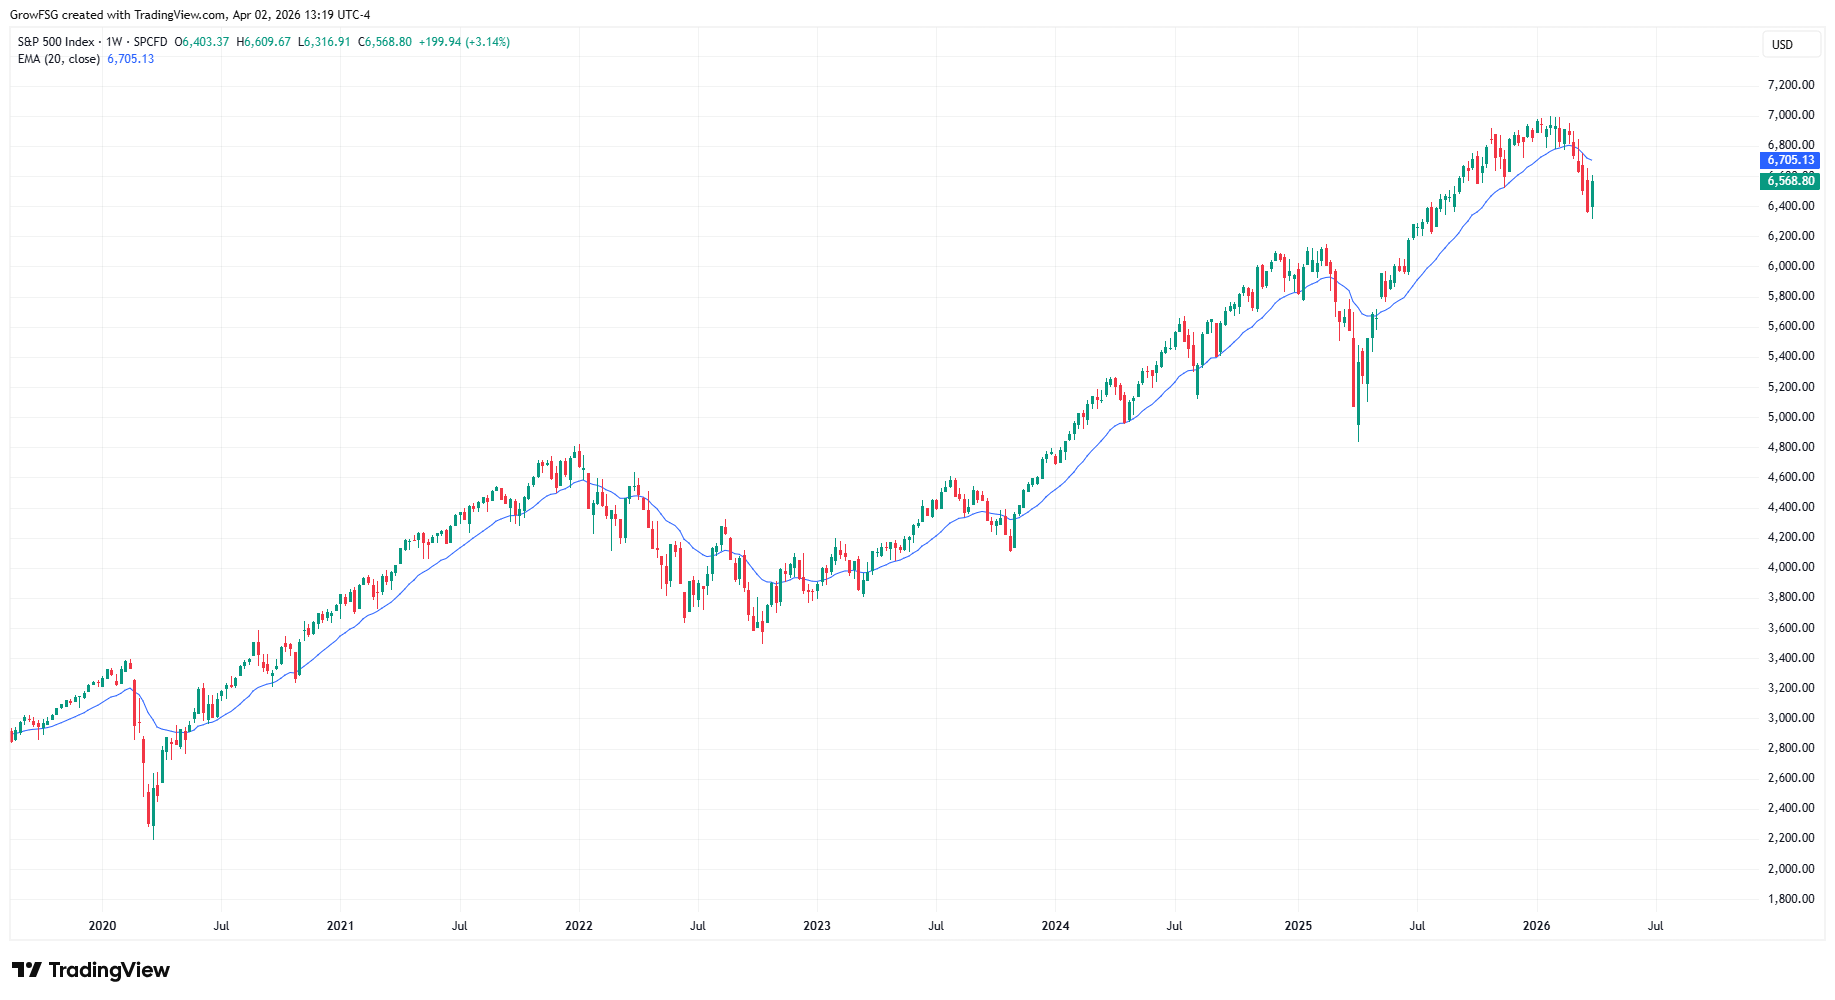
Support levels represent areas where buyers previously stepped in.
We can see that the 2022 bear market ended at the first major consolidation channel coming off the Covid bottom. Likewise, the 2025 correction ended at the January 2022 peak. Prior highs frequently provide support for future corrections.
We never know when a downtrend will end, but we can anticipate potential support or reversal levels by identifying prior tops and consolidation levels.
When support breaks, it often signals increasing downside risk. A great example of this is the 2025 correction. Price initially fell to the early July 2024 peak. When support at that level failed, price fell another 15% to the April 2025 bottom.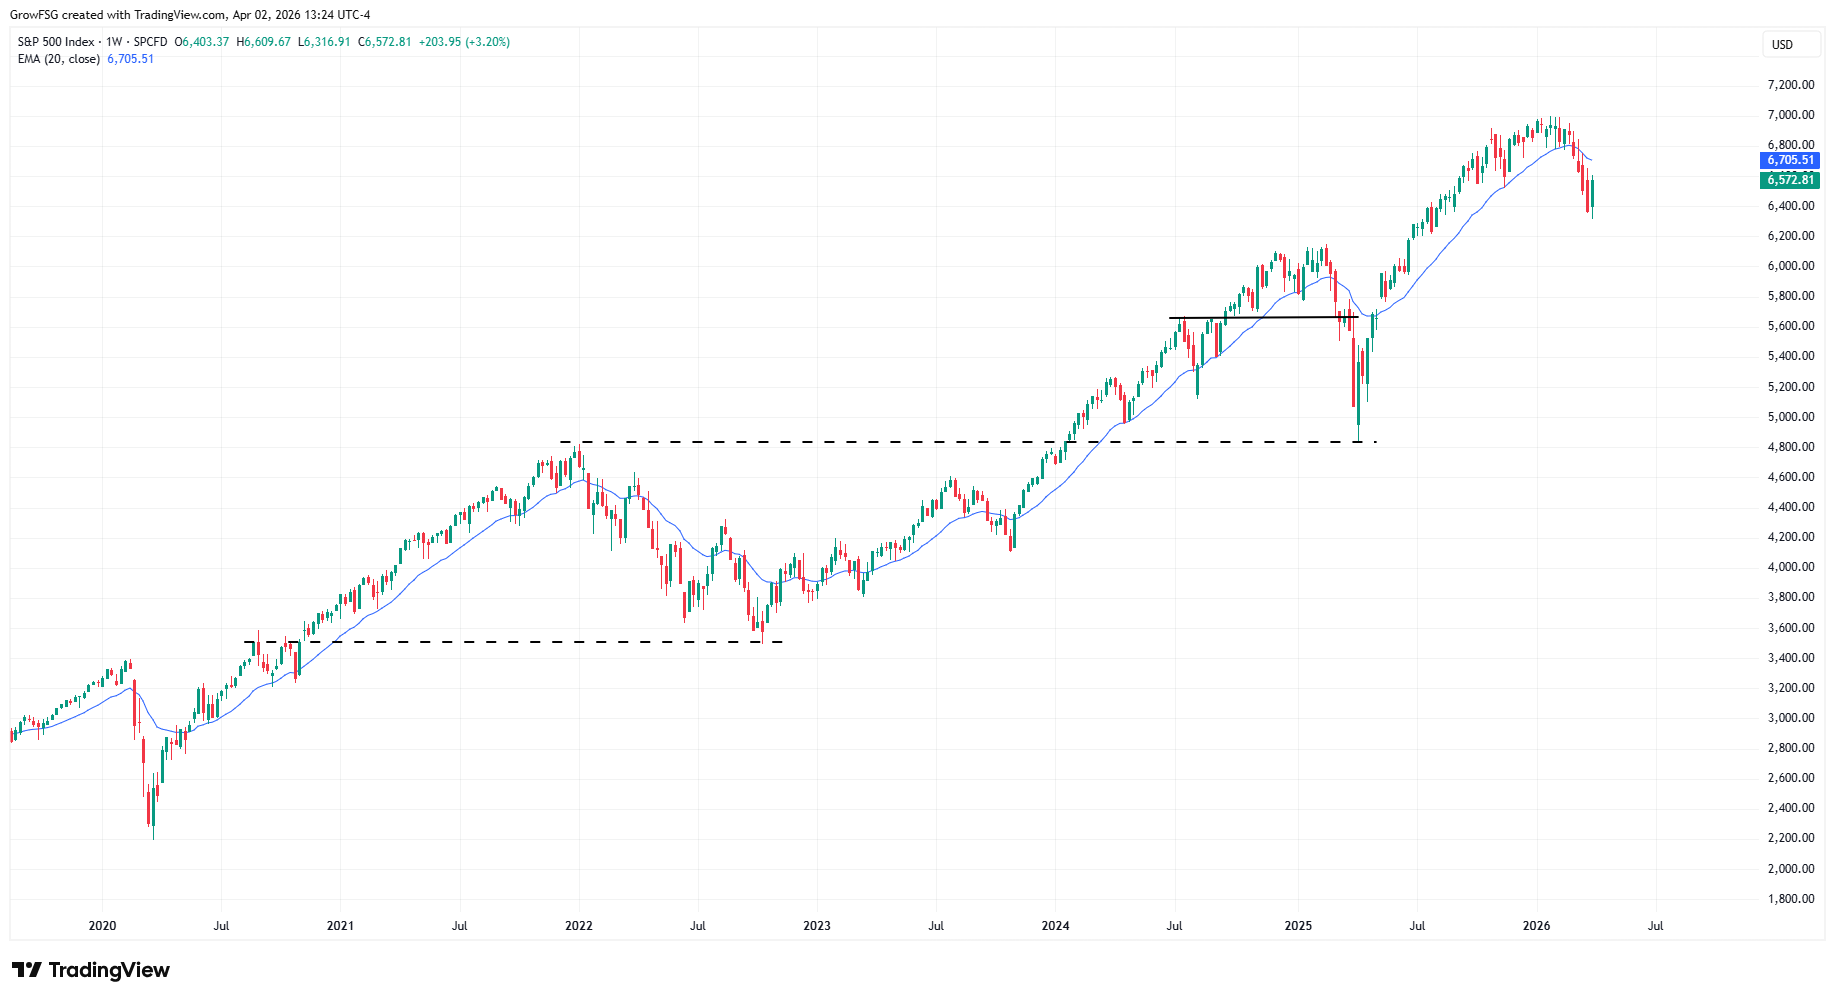
The Moving Average Convergence Divergence Oscillator (MACD) is a technical indicator that helps investors identify price trends, measure trend momentum, and identify points for reallocating between the TSP funds.
MACD tells us the momentum or strength of a move over time; either up or down. Momentum is strongest out of a significant bottom. As price continues to rise, momentum wanes as price nears a peak. Negative and declining momentum as price continues to rise is a big red flag that a top is likely imminent.
We see several examples in the chart below where price continues higher as momentum is negative and declining.
MACD is not a timing tool. It does not tell us when the top in price will be in place. What it does identify is a decrease in the momentum of the rally. It's an early warning indicator that supplements the weekly moving average line, and supports the risk/reward ratio.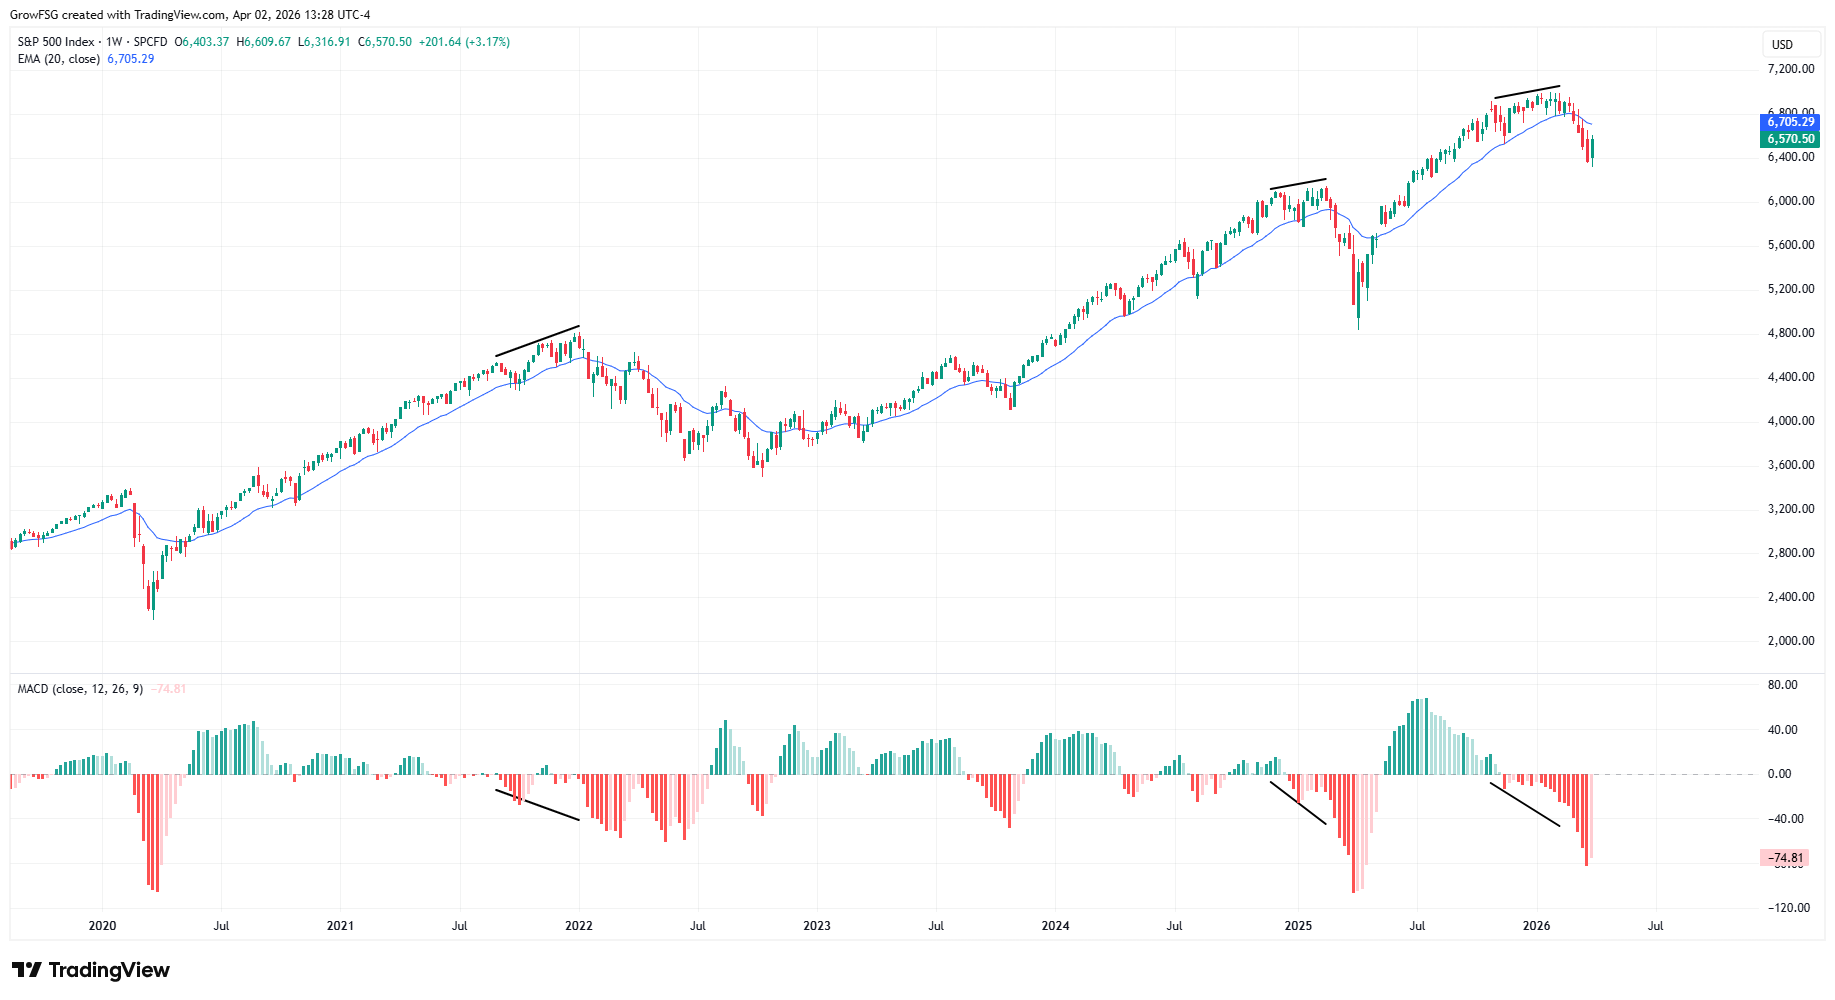
The TSP is NOT a day trading platform. It is designed for long-term wealth accumulation. The two move per month rule ensures that TSP account holders are not attempting to day-trade their TSP account. As a result, TSP investors need to make reallocation decisions thoughtfully. The goal is to side step major drawdowns that could impact future gains and retirement plans, not to avoid short-term pullbacks.
"You lose money fast in the stock market. You can’t make it fast." - Peter Lynch
There's a saying on Wall Street that stock price takes the escalator up and the elevator down. Stocks, or the TSP funds, tend to fall much faster than they rise. Fortunately price movement is not random. Price moves in identifiable patterns. Moving average lines and indicators like MACD help us anticipate and respond to trend changes before major declines.
Why is this important? Because gains come slower than losses and the math works against you.
If you lose 10% of the value of your account, you need to gain 11% to get back to even. If you're down 20%, you need a 25% gain. If you lose 50% of the value of your account, you need to make 100% on what's remaining just to get back to even.
The best example of this is the "lost decade" from 2000 to 2013. Over that time period, the S&P500 sustained two 50% drawdowns and took 14 yrs to get back to even. Avoiding these large drawdowns can be a game changer for your retirement nest egg.
In early March 2026, the S&P500 had been in a rally since the April 2025 bottom. Momentum (MACD) turned negative in November and continued to decline. A weekly closing price below the 20WMA occurred on Friday, 06 March.
Using the 20WMA as a trigger and MACD as support, the stage was set for a correction in the S&P500.
This was a decision point. The analysis was suggesting further price decline, but analysis is NOT a crystal ball. Could price have turned higher and invalidated the trigger? Yes, it was possible but not the highest probability.
The best way to use this analysis is to go back to the first quote from Peter Lynch. "If I’m right, how much am I going to make? If I’m wrong, how much am I going to lose?”.
As of early March 2026, downside risk was very high compared to the potential upside in the S&P500 (our C fund). How you applied this analysis was based on your personal circumstances and risk tolerance.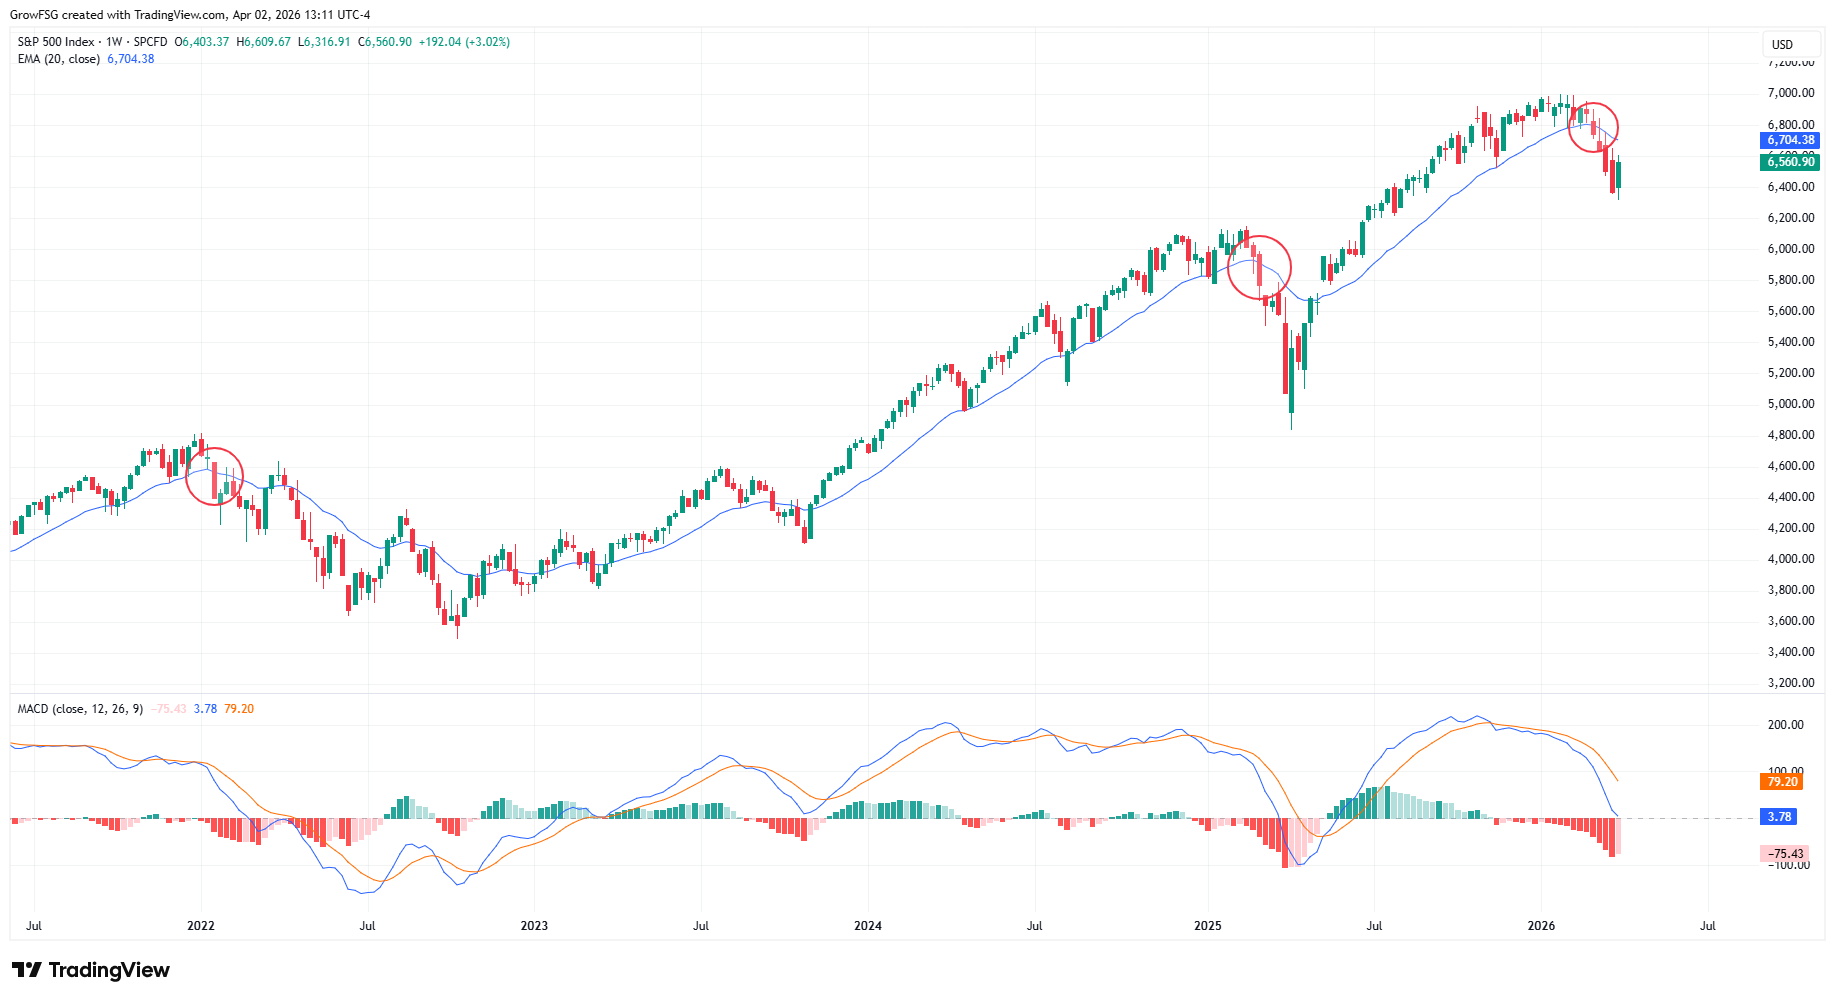
Risk is a systemic feature of investing in the TSP. Only the G fund is risk-free. The other 4 core funds, and the L funds, are susceptible to geopolitical, socio-economic, and market risks.
Managing risk is both an art and a science. There are no guarantees. All reallocation decisions come with risk. Our job as investors is to identify market risk and respond accordingly, within the bounds of our personal circumstances and risk tolerance.
Fortunately, technical analysis provides us with tools to help us make educated reallocation decisions. Understanding and applying these basic tools can help TSP investors stay on the right side of the market, maximize gains, and minimize downside risk.
-----------------------------------------
GrowMyTSP.com does not provide personal investment advice. We are an education and analysis service, helping TSP investors grow their accounts using strategies and models that best fit their personal circumstances and risk tolerance. Get started at GrowMyTSP.com.
