
Charting 101
The Price Chart
This is where the rubber meets the road in actively managing your TSP account. In this post we look at the basics of a Price Chart, some simple technical analysis tools, and the importance of multiple time frames.A price chart is a graphical representation of price movement over time. Price over time can be depicted in a variety of ways that best suit the analyst. Here we will focus on a basic price chart and look at the 2 primary ways we show price.
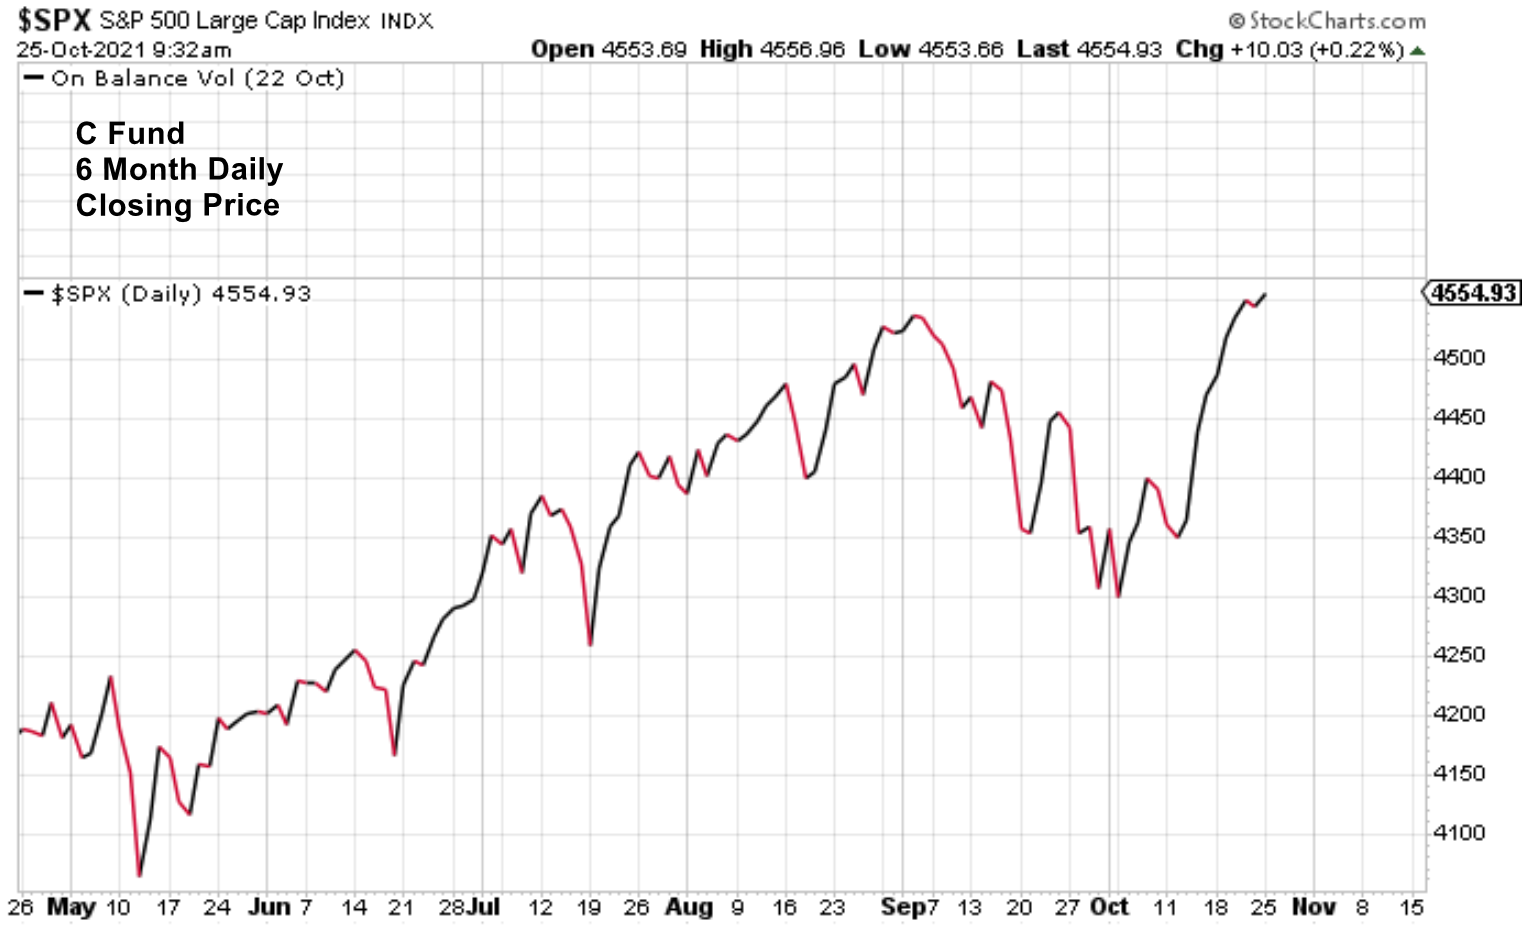
The chart below is a 6 month chart of the S&P500 (C Fund) where Time is the X axis and Price is the Y axis.
Each day’s closing price is connected together to form the line chart. The black lines indicate time periods where price was rising, while red lines indicate time periods when price was falling.
We can see that, overall, price has moved steadily higher over the past 6 months.
Within that overall move higher, price moves higher, contracts, moves higher again, contracts, etc. The September correction was more significant that the previous V shaped corrections but, the overall price trend remains in place.
Recognizing the Trend
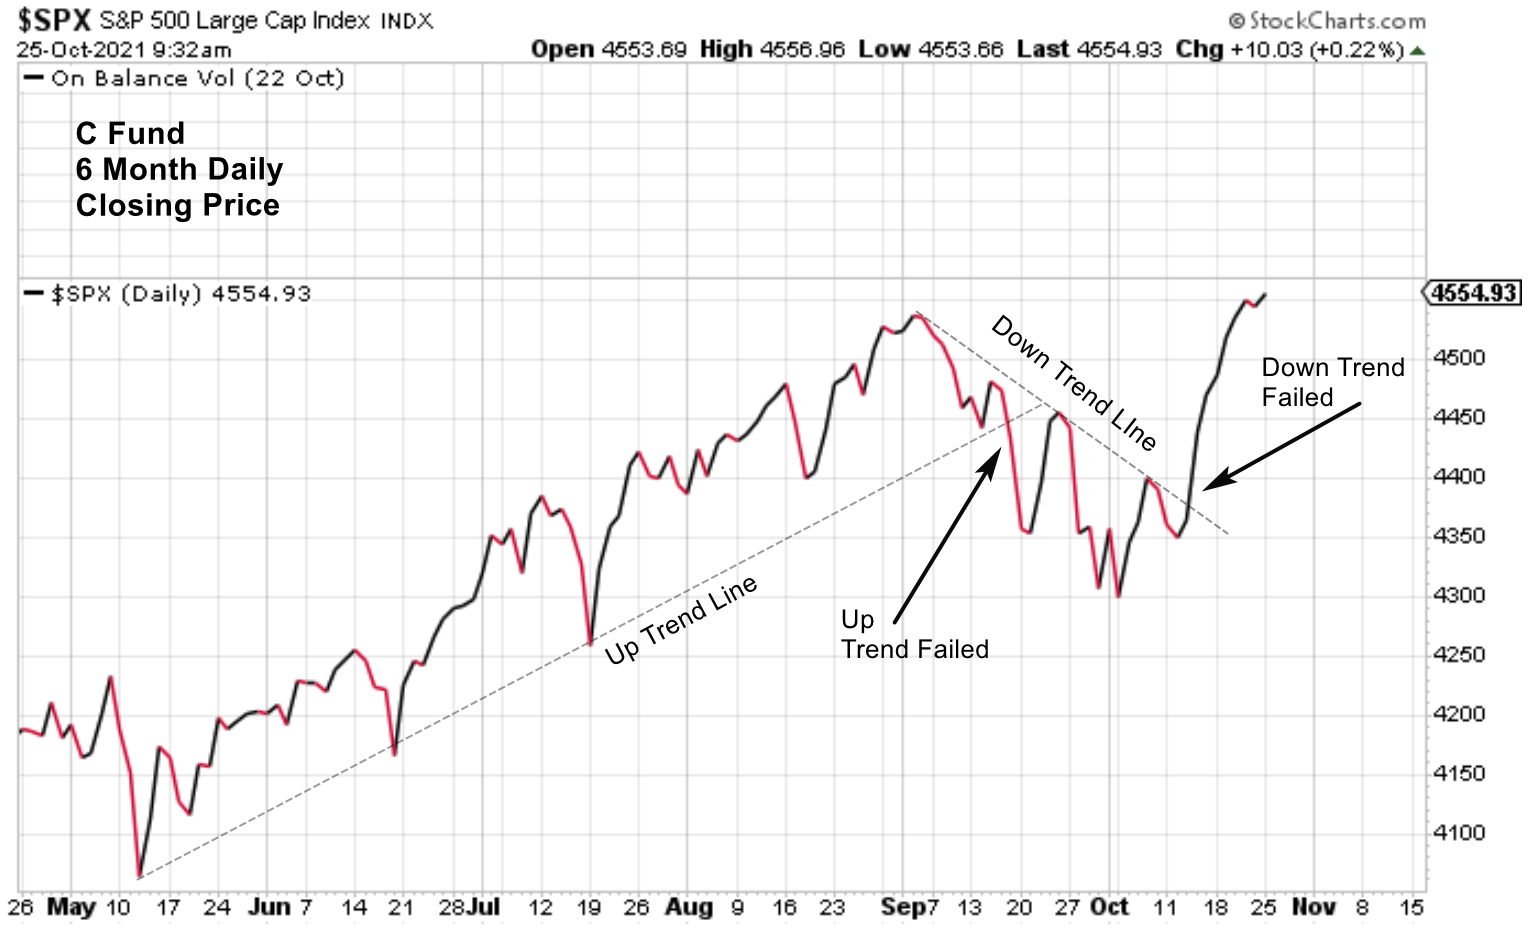
The simple line chart gives us a lot of information. Most importantly, it shows us daily price movement with respect to historical price movement.Your eye can see that, from mid-May thru the 13th of September, price was in an upward trend.
That trend was broken during the week of 13 September.
Now your eye can see the shorter down-trend from early September to early October.
Finally, the week of 11 October ended this short term down trend.
By drawing a line connecting the significant higher lows, we establish the up-trend line. By connecting the significant lower highs, we establish the down trend line.
Why is this so important?
Understanding trend gives you the ability to put daily price moves in perspective.
In this chart, there are only 2 days that really matter, 17 September and 15 October. On 17 September, the up-trend since May was broken and the short term down trend began. On 15 October, the down trend was broken and a new up-trend began. Understanding basic trend keeps you from stressing over the day to day price movement.
Candle Sticks
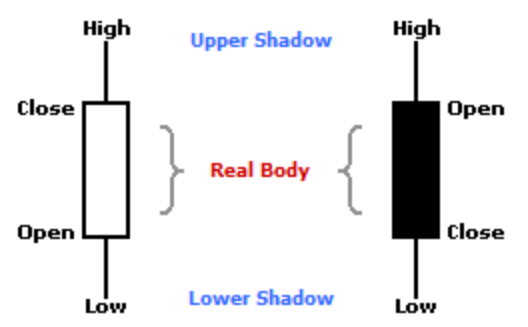
Another way to represent price on a basic chart is with Candle Sticks.Rather than connecting the closing price, each days entire price range is represented by a candle stick. (For a deeper dive into Candle Sticks, click here. This is a MUST READ!).
Candle Sticks give us a tremendous amount of information in one picture. Each candle stick tells us:
- the opening and closing price,
- the daily high and low, and
- price relative to the previous day.
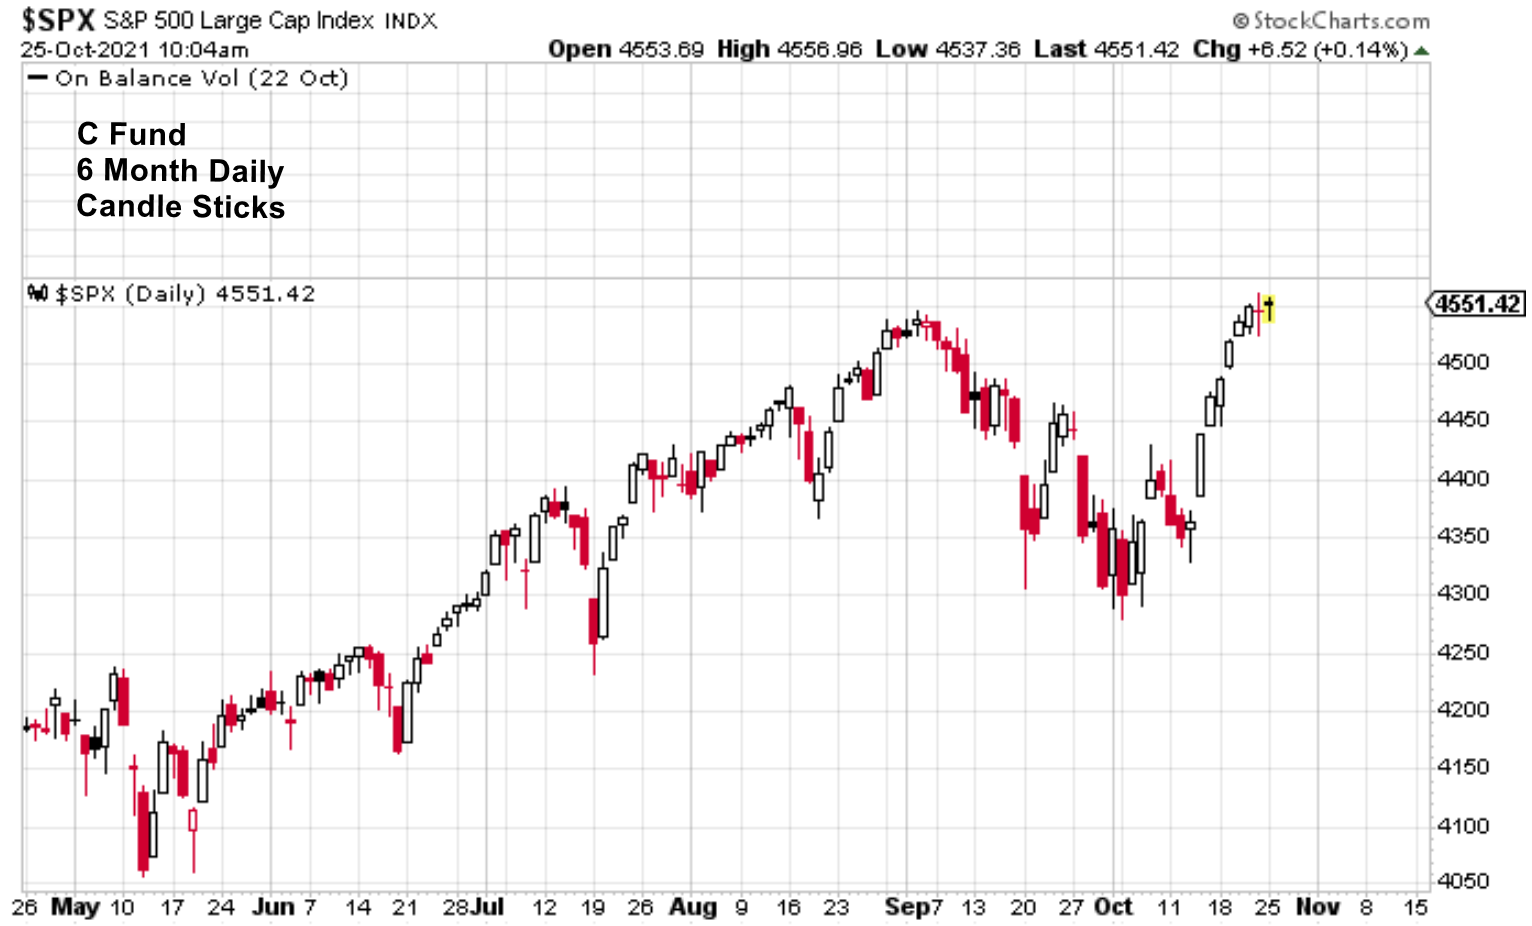
Because of the volume of information conveyed, we primarily use Candle Stick charts at GrowMyTSP.com.
Keeping with the same 6 month daily chart of the S&P500 (C Fund), but using Candle Sticks, we can see the gap down on 17 September that ended the May to September up-trend.
We can also see the gap up and explosive move higher on 15 October that ended the short term down trend.
Technical Analysis Tools
Price action itself is the single most important focus of technical analysis. To support our analysis of price, we have a variety of tools that can help us anticipate future price movement. There are dozens of tools and indicators available. In this post, we will focus on two of the most important; Volume and Moving Average Lines.Volume
Volume is the number of shares that trade over a given time period. In the 6 month daily chart of the S&P500 (C Fund) chart below, daily volume is shown below price. On the days when price goes up, volume is black. On the days when price goes down, volume is red. Increasing volume when price is moving higher is a strong, bullish sign for the market. Increasing volume when price is decreasing is a weak, bearish sign for the market. High volume spikes, after consecutive down days, can often signal the bottom of a correction. This is clearly visible in the chart below. (For a deep dive into Volume click here)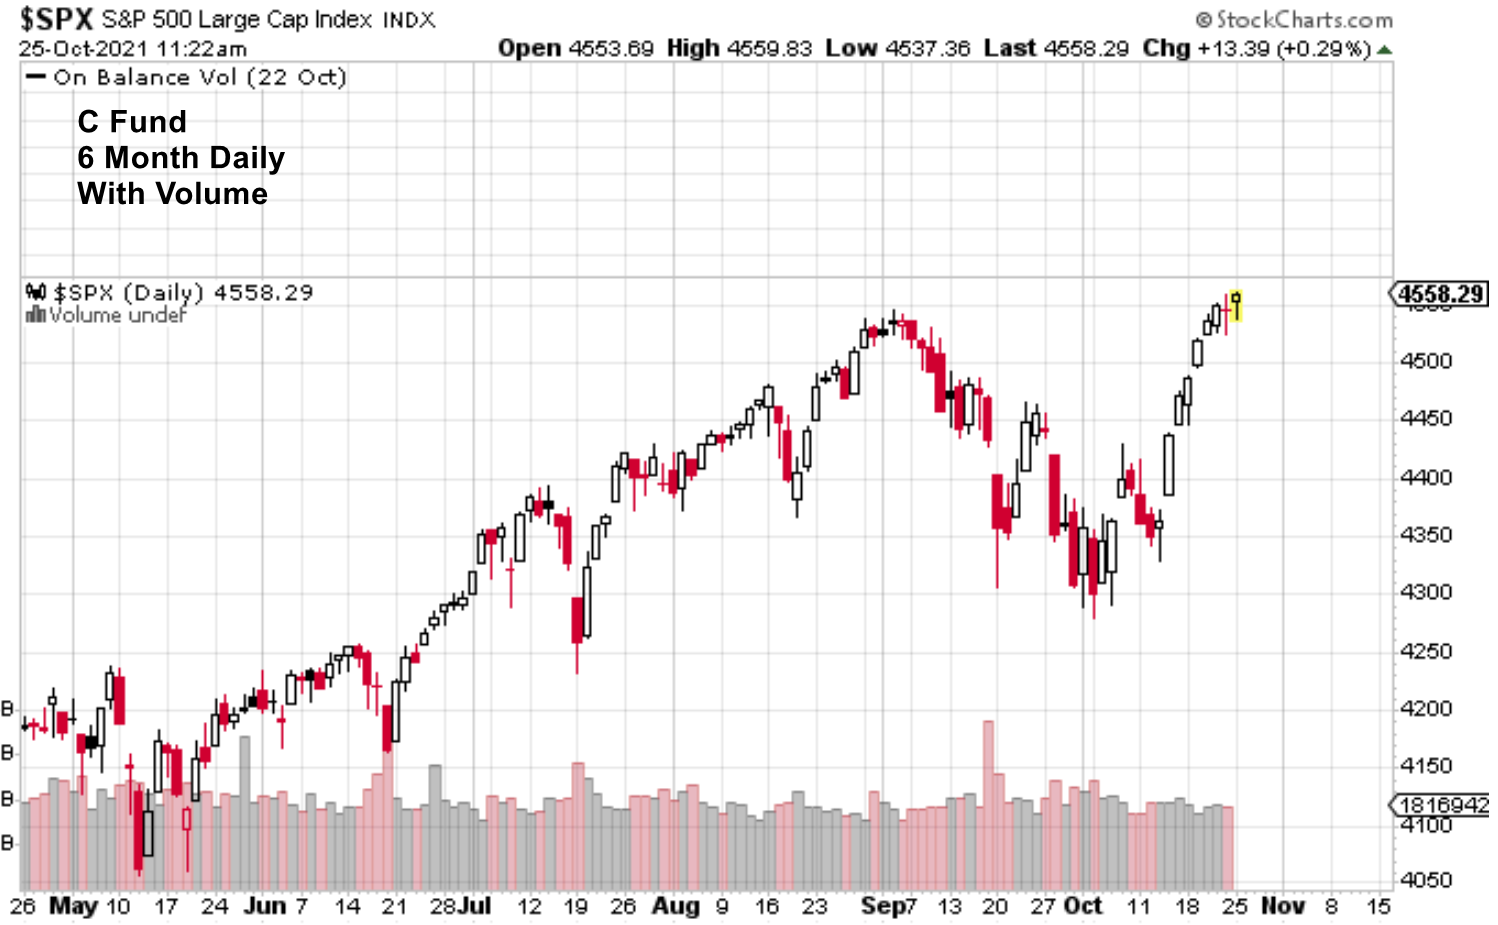
Moving Average Lines
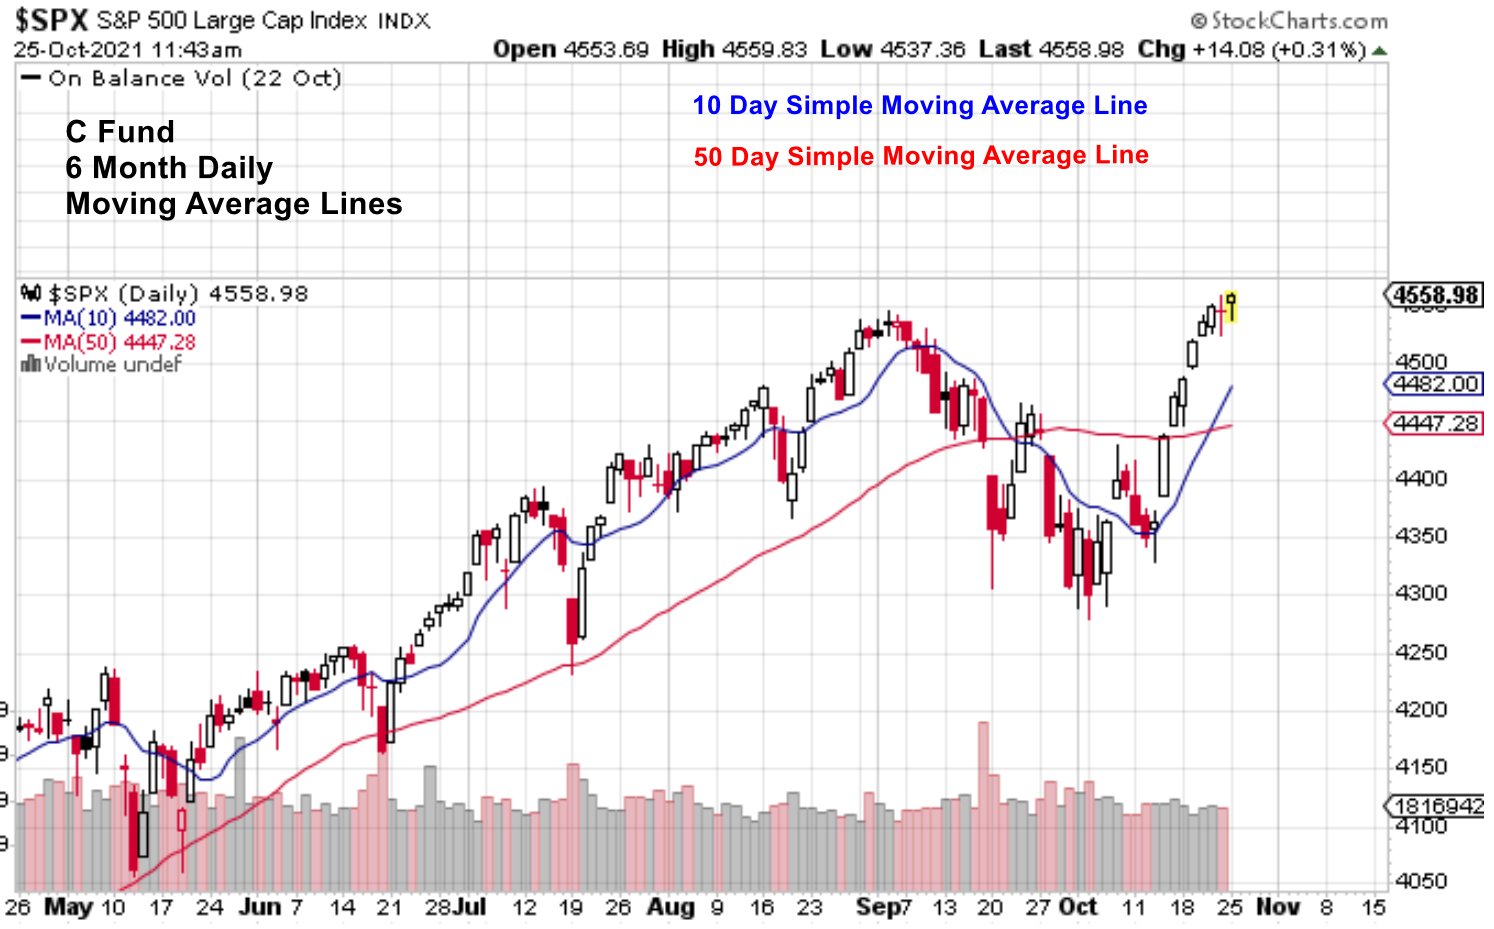
A simple moving average is the rolling average closing price over a fixed time period. In the 6 month daily chart below, the blue line is the 10 Day Moving Average (DMA) line and the red line is the 50DMA.Moving average lines smooth out the “noise” of daily trading activity. The shorter the moving average line, the more volatile. The 10DMA line moves up and down much more quickly than the 50DMA line.
Moving average lines are a very useful tool for us. Most importantly, they provide us with areas of price support and resistance.
Support & Resistance
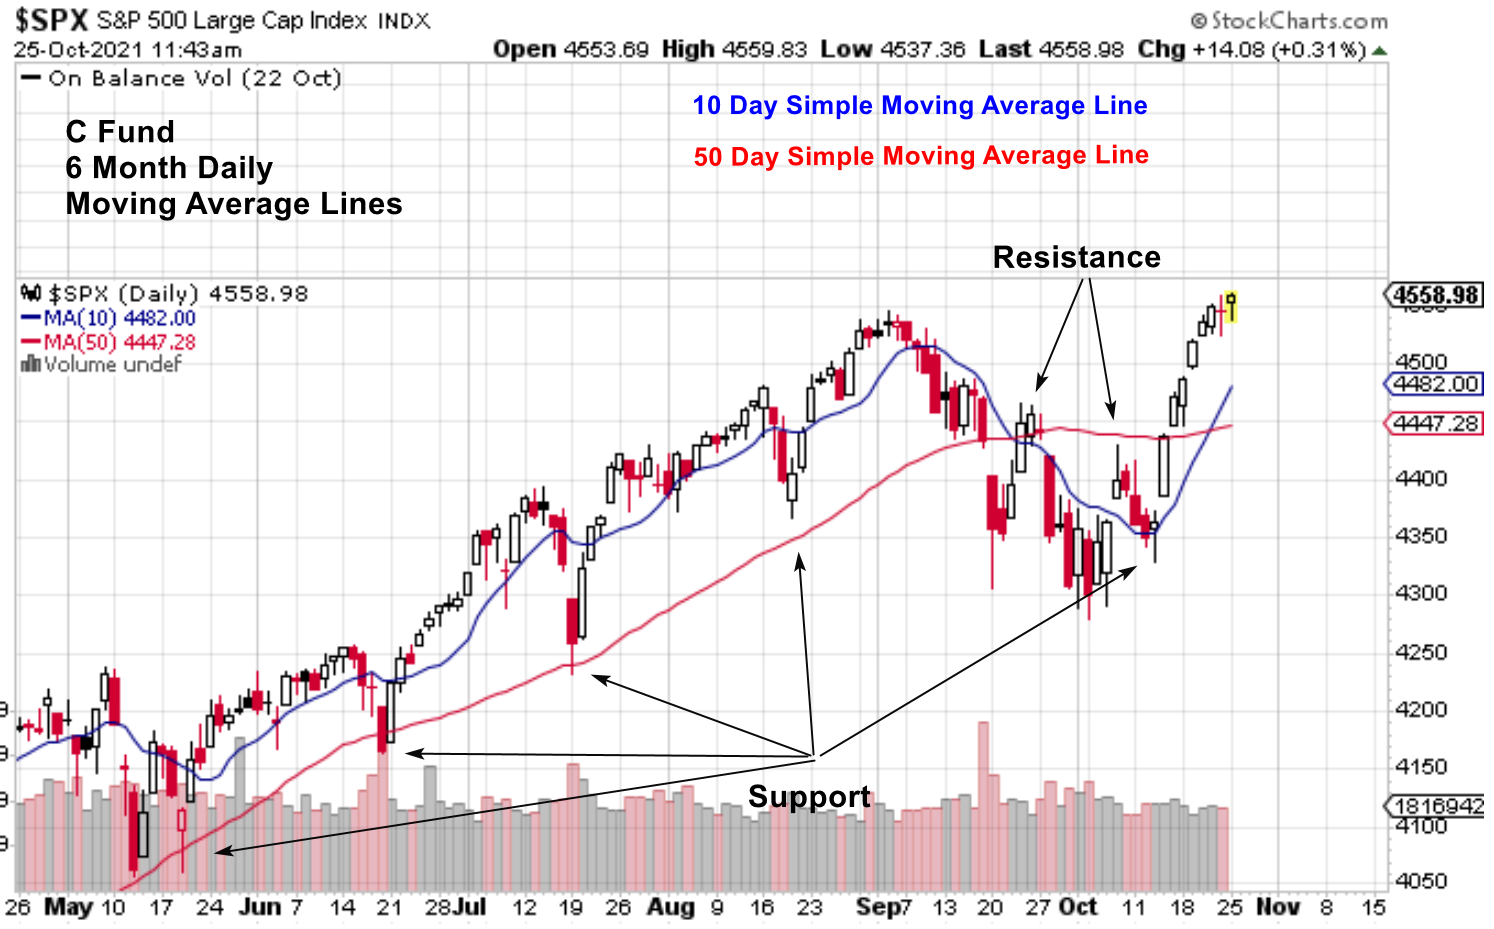
In the 6 month daily chart below, we can see that when price is moving higher, it generally finds support at the 10DMA. When the 10DMA is violated, price usually continues down to support at its 50DMA before continuing the up-trend.From 07 to 17 September, price action changed.
Price violated its 10DMA on 8 September and couldn’t get back above it.
Where the 10DMA had been acting as support for price to move higher, now it was acting as resistance.
Finally, on 17 September, price violated its 50DMA for the first time in 2021.
On the recovery rally, price barely got back above its 10DMA and 50DMA before retreating to new lows by early October.
The next rally attempt was a gap up through the 10DMA that hit resistance at the 50DMA, followed by support at the 10DMA 3 days later.
The 15 October explosive move higher, following support at the 10DMA, began a successful rally and a new up-trend.
Moving average lines are a very useful tool. What price does at its moving average lines plays a big part in our TSP reallocation decisions.
Multiple Time Frames
Throughout this post, we have used the 6 month daily chart of the S&P500 (C Fund) to demonstrate the application of basic technical analysis tools.The chart below is still the S&P500 but, this is a 3 year weekly chart.
Here we are looking at the past 3 years where each candle stick and volume bar represents price and volume movement over 1 week. The blue line is the 10 Week Moving Average (WMA) line and the red line is the 50WMA.
We can see that Support and Resistance works just the same on a longer term, weekly chart as it does on a shorter term, daily chart.
By expanding the time frame, we can now put the September correction in perspective to the overall rally that began at the CoVid low in March 2020.
The September 2021 correction was the first significant correction that we have seen since September 2020. We can see a strong move to the upside during the 3rd week of October 2021 reclaimed the 10WMA. Going forward, we should expect support at the 10WMA as price continues higher.
As you gain more experience in interpreting price charts, you will begin to see patterns within patterns.
The shorter term patterns develop into the longer term patterns. We can zoom in to minute by minute charts, or zoom out to a 100 year monthly chart. This is the Fractal nature of chart patterns and is a critical concept to understand.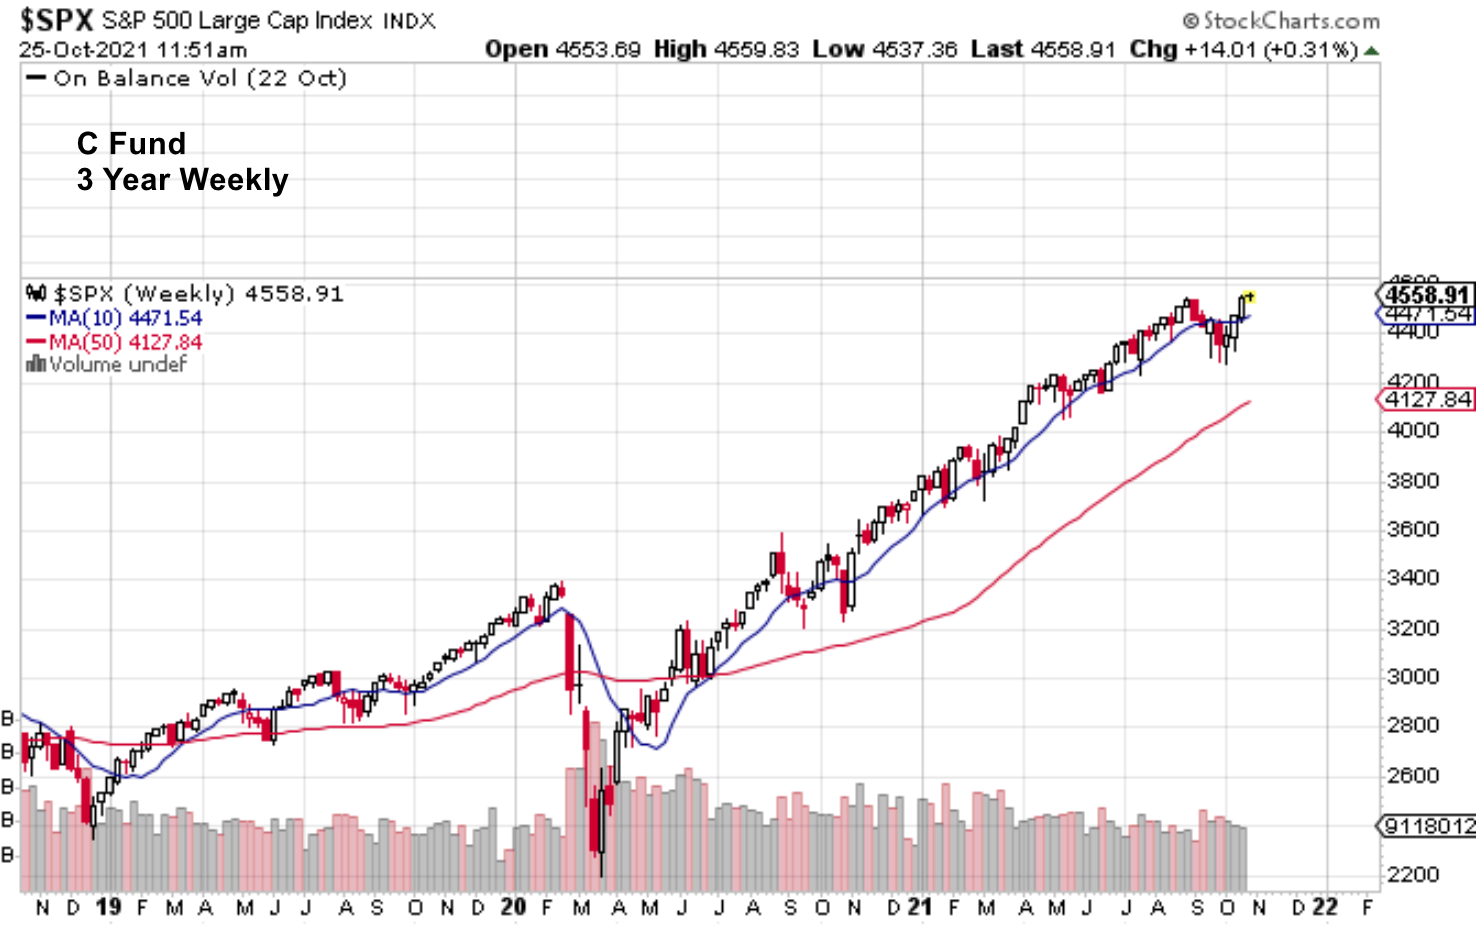
Bottom Line
We have covered quite a bit in this post. You should now have a basic understanding of price charts, trend, volume, moving averages, and support & resistance.Now is the time to practice. The only way to get comfortable with charting is to practice!
Go to www.StockCharts.com and play around on the site. Put in the ticker symbols that correspond to the core TSP funds. Play with the chart attributes, overlays and indicators. We utilize both StockCharts and TradingView as charting platforms.
It will be a bit overwhelming at first but, you will get the hang of it with a little practice. Practice will go a long way in helping you fully understand what we are discussing on the Weekly TSP Weekly Podcast, the TSP Weekly Newsletter, and the Alert Analysis.

Copyright Grow Investments, LLC | GrowMyTSP.com
Thrift Savings Plan Disclaimer
Neither growmytsp.com nor any of its partners or representatives is in any way affiliated with the United States Government, The Federal Retirement Thrift Investment Board (FRTIB.gov) or the Thrift Savings Plan (TSP.gov), and any service being offered is not sanctioned by the United States Government, the Federal Retirement Thrift Investment Board or the Thrift Savings Plan.