
It was an exciting week for both stocks and bonds! We had a nice breakout in the C fund which triggered an Alert on Thursday and a change in the Grow Model Portfolio. We also saw what could be the beginning of a major leg down in the F fund... For the week the C fund closed higher by 1.65%, S fund up 1.86%, I fund up 0.71%, and F fund down 1.32%. We have a lot to cover this week but first, a little one-off for some perspective...
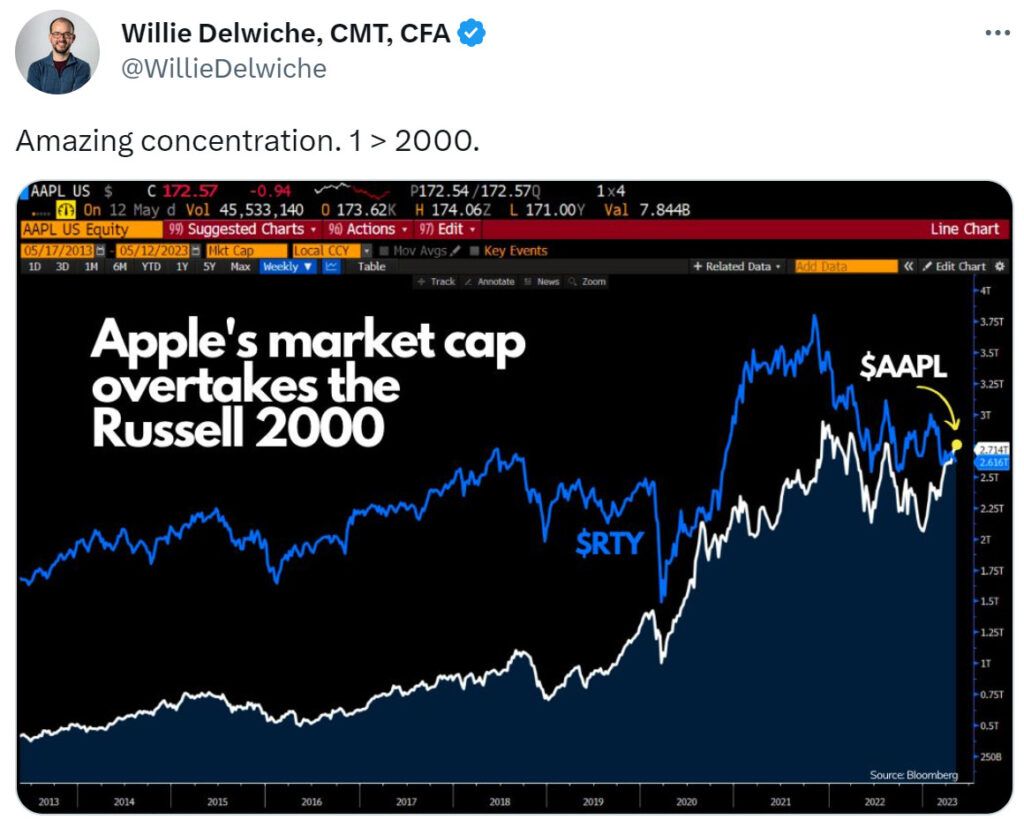
In last week's Podcast, we took a look at the Small Cap Index. The market cap (Capitalization) of a stock is the number of outstanding shares multiplied by the stock's price. A cap weighted index, like the S&P500, gives more weight to higher cap stocks. Since the market cap of Meta, Apple, Amazon, and Google are so high, they are really driving the overall market higher.
The tweet below from Willie Delwiche really puts things in perspective. When the market cap of ONE COMPANY is above the cap of the entire Russell 2000 Index, something is out of wack! We need to see more breadth, more of the small caps making new highs for this rally to really move to the upside!
The Second Half of the Alert Analysis Story
We posted an Alert on Thursday night that was effective for Friday's closing price. If you haven't read the analysis or watched the attached video, do that now and come back to this!
Technical analysis shows us the three components to successful, long-term trading. First is when to buy a stock. Second is when to sell a stock. Third is how to confirm your buy or sell decision. We reallocated to 30% C fund, 20% S fund and 50% G fund effective on Friday's closing price. All the details are available in the Alert Analysis so, we won't rehash that here. That was the buy trigger.
The next step is confirm our buy decision. The C fund gave us a beautiful Cup & Handle pattern with a breakout to the upside this week and a close above the resistance line at 4188. That was the buy trigger. For price to move significantly higher, it needs to clear the August high at 4300.
The Cup & Handle pattern can fail. We will know this if price closes below the April/May double bottom. That would be the final line in the sand. Ideally, price does not close below the upward sloping 20DMA on a pull back.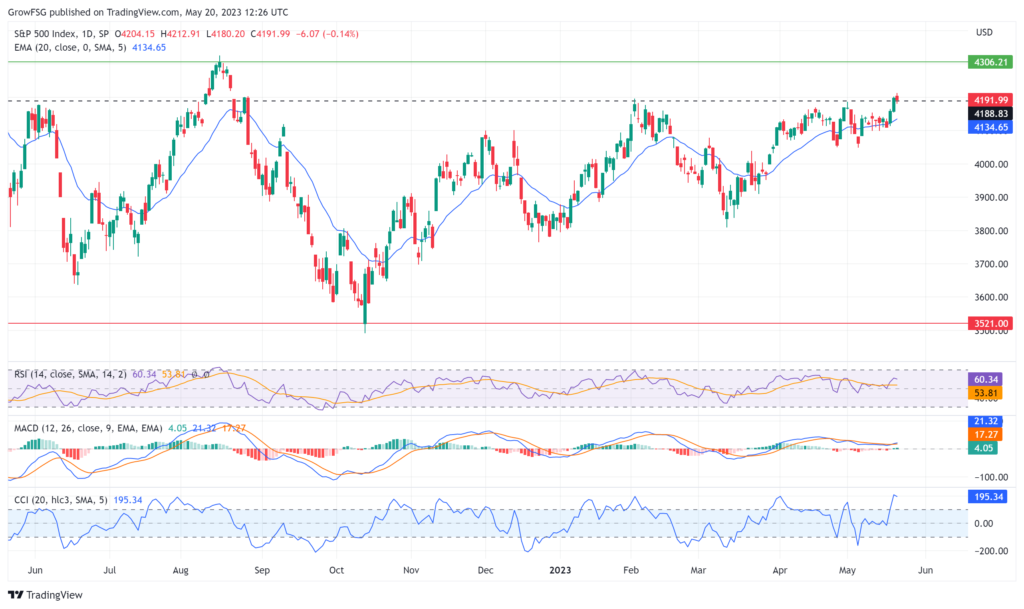
The S fund Head & Shoulders pattern is still in play but, this week's breakout above the 20DMA line is very bullish. A daily close below the neckline is our line in the sand for the S fund.
If this rally is to continue, the S fund will need to get onboard with this rally! This week's price action is a good start but, the C fund will not rally and leave the S fund behind.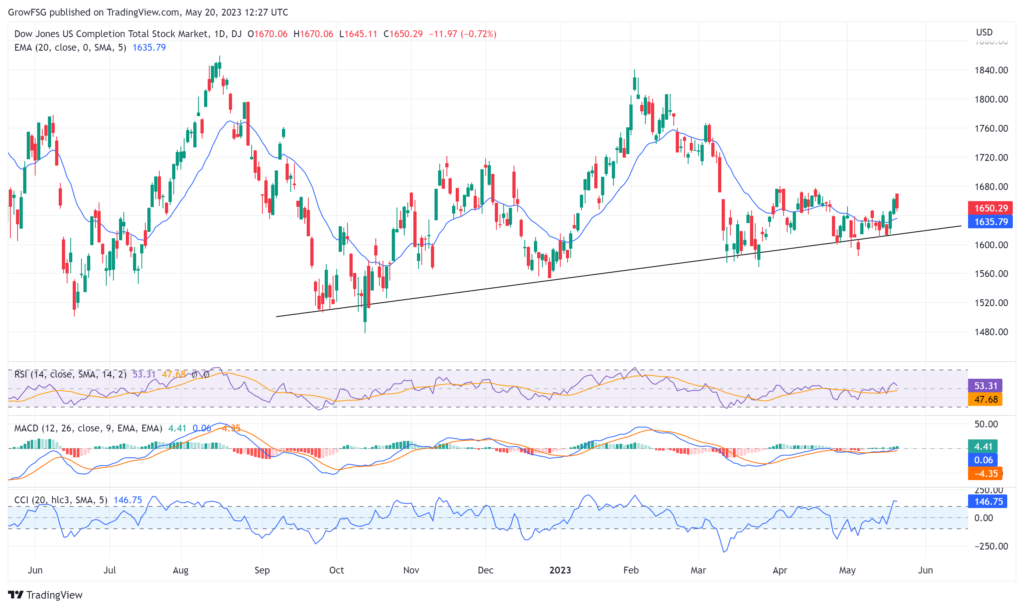
The I fund popped a bit on Friday because the dollar was down. Our view is that the I fund has topped for now and should roll over as the dollar continues to strengthen.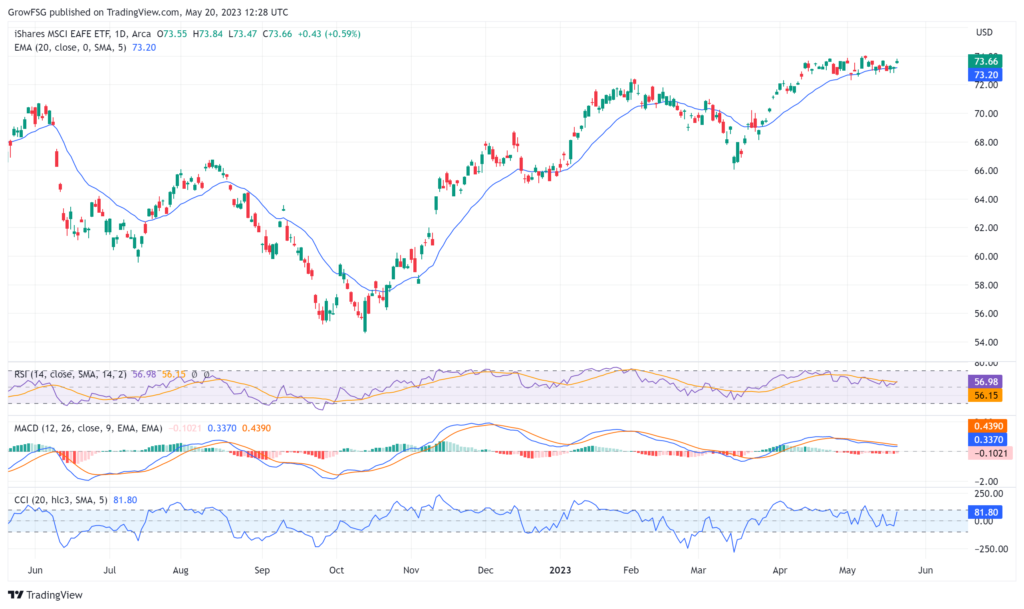
The F fund had a rough week. It looks like the beginning of the next significant down leg. We know that stocks and bonds have generally moved in the same direction since January 2022. The question is, will that trend continue? If yes, then is the F fund leading? Should we be concerned that stocks will follow bonds lower? ABSOLUTELY we have to be open to that possibility.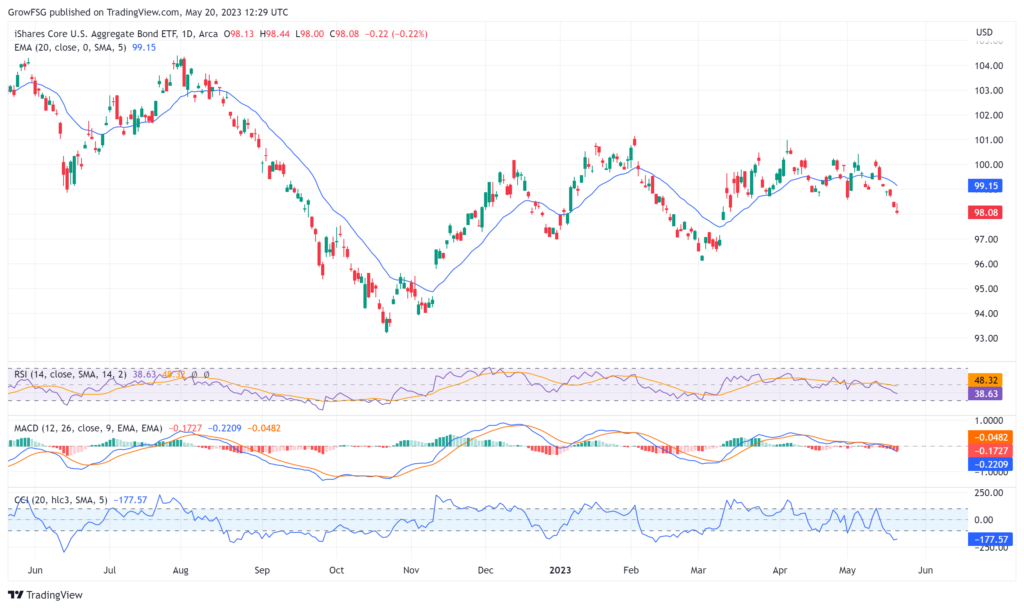
Long Term Yield
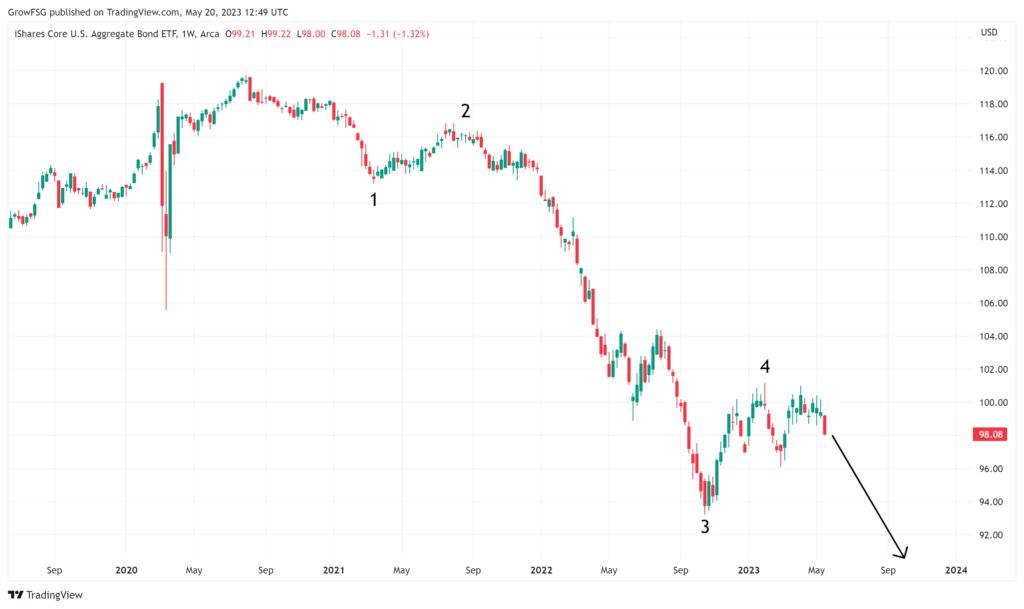
This is the most interesting, long term topic of the week. We know that what really crushed the 60/40 stock/bond allocation in 2022 was the historic decline in bonds. Since its top in 2020, the F fund has seen its worst decline in the history of the fund. That does not mean that it can't go lower! In fact, the Elliott Wave count calls for another leg to the downside and this week could be the beginning.
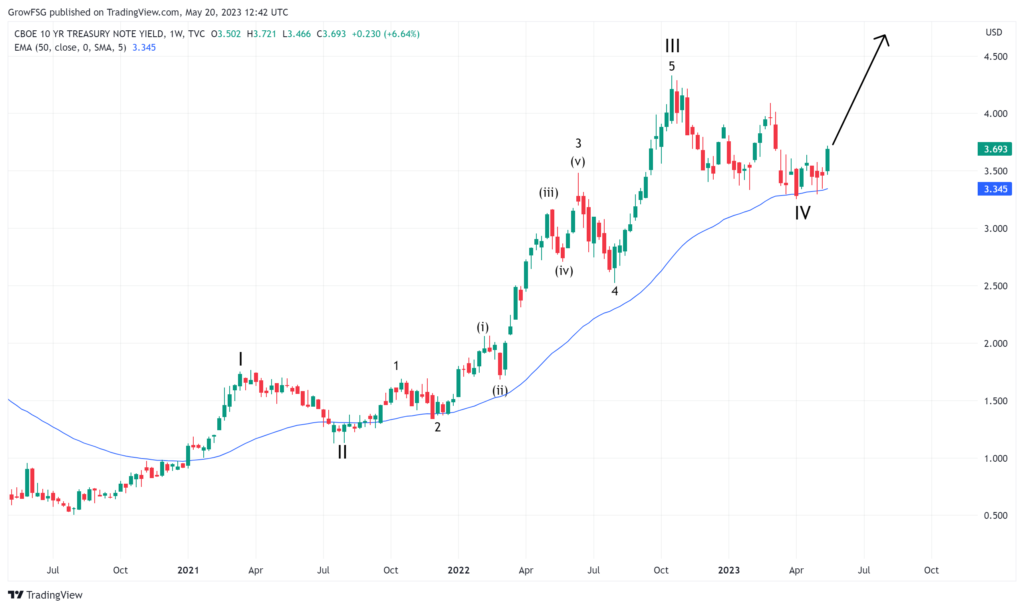
The price of bonds move inversely to the yield. The chart below is the 10 year yield. After its bottom in mid 2020, the 10 year yield has progressed in a perfect Elliot Wave move with support of the 50WMA at the II and IV legs. This week's breakout to the upside, from support at the 50WMA, SHOULD be the beginning of the wave V higher.
While most analysts are calling for the FED to pivot and lower interest rates by the end of 2023, the Elliott Wave structure and current price action is telling us the exact opposite!
Bottom Line
We have a breakout of a Cup & Handle pattern on the C fund with overhead resistance at the August 2022 high. We have, what looks like a failed Head & Shoulders topping pattern in the S fund which is bullish. The I fund looks to be topped out given the strength of the Dollar, and the F fund looks to be entering its next major down move.
In the short term, there is A LOT going on in the market! Hopefully this rally in stocks holds for a while and we can see some gains this summer. What's more important is the long-term chart of yield and the F fund. If the F fund gives us a wave 5 down, the bottom of that 5 wave will truly be an historic opportunity in the F fund and long term treasury funds in the Mutual Fund Window. Much more on this as it evolves...
Have a great week!
The Grow My TSP Team
